

Quarterly Strategy Report: Global Equity Opportunities
January 03, 2023In our Quarterly Strategy Report, we illustrate the relative attractiveness of select developed international sectors.
Prefer to download this presentation in PDF? Please click here.
1. Summary
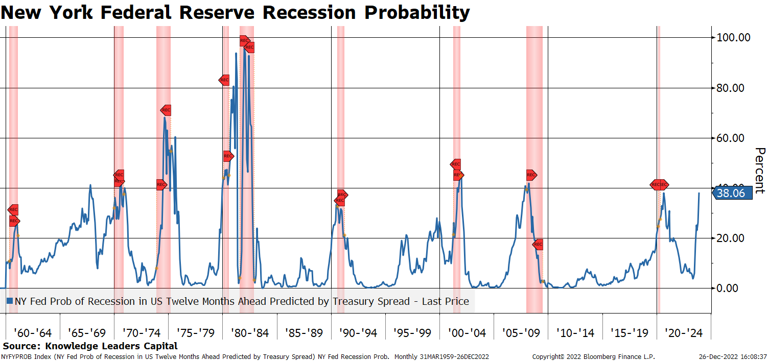
-Monetary policy is considerably more restrictive than many perceive. The San Francisco Federal Reserve has calculated a “Proxy Rate” that includes balance sheet policy and forward guidance. This rate is 6.45%, well above current measures of core inflation. Using this rate in a yield curve analysis, we see that the US Treasury curve out to ten years is inverted by 281 basis points. In combination with the Conference Board’s leading economic indicators contracting at 7.3% annualized rate (AR) over the last six months, recession probabilities have risen to elevated levels.
-The prospect for recession likely explains the fall in long US Treasury rates and concomitant drop in bond volatility. As bond volatility has receded, the USD has fallen. These conditions of lower bond volatility and a falling USD are favorable to risky assets.
-In the e-commerce economy, deflation has already set in with the Adobe Digital Price Index -1.9% over the last year. Bloomberg 2023 US CPI estimates rolled over in December. Should the US economy fall into recession, inflation would likely fall faster than many believe. A slowing economy and slowing inflation may be enough to engender an early end to Federal Reserve rate hikes. The fed funds futures curve tops out under 5% in 2023.
-With US stocks the most richly valued in the world, it may be time to turn toward international equities selectively. A falling USD and global monetary policy convergence should, we believe, improve the investment prospects for developed international equities. We highlight our method of capitalizing intangible investments to illustrate the relative attractiveness of select developed international sectors compared to the US.
-The developed regions outside North America have some unique features that provide the opportunity to assemble a portfolio of highly innovative companies across all industries and geographies
2. Fed Funds are more restrictive than perceived.
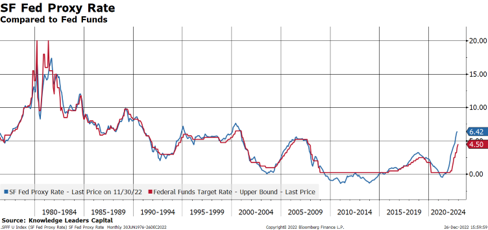

This site presents a monthly series of the proxy funds rate, following Doh and Choi (2016) and Choi, Doh, Foerster, and Martinez (2022). This measure uses public and private borrowing rates and spreads to infer the broader stance of monetary policy. When the Federal Open Market Committee uses additional tools, such as forward guidance or changes in the balance sheet, these policy actions affect financial conditions, which the proxy rate translates into an analogous level of the federal funds rate.
This measure uses a set of 12 financial variables, including Treasury rates, mortgage rates, and borrowing spreads to assess the broader stance of monetary policy. Using principal components, common movements among the 12 financial variables are extracted. The first three principal components are then mapped to levels of the federal funds rate, where the mapping reflects the pre-2008 correlations between them. Until December 2008, the mapping is nearly exact by construction; after 2008, the mapping from financial conditions to the funds rate diverges. This separation displays how the proxy funds rate responds to developments in financial conditions such as forward guidance and balance sheet operations.
The proxy rate can be interpreted as indicating what federal funds rate would typically be associated with prevailing financial market conditions if these conditions were driven solely by the funds rate.
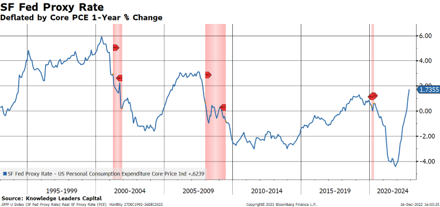
3. Using the SF Fed Proxy rate, real rates are 1.7% using the personal consumption expenditure price deflator. Rates are above the inflation rate, which many see as a necessary condition to slow (the already slowing) inflation rate.

4. The e-commerce economy is already back in deflation.

The Digital Price Index is the most comprehensive measure of inflation in the digital economy. It is modeled after the Consumer Price Index, published by the U.S. Bureau of Labor Statistics, and uses the Fisher Price Index to track online prices.
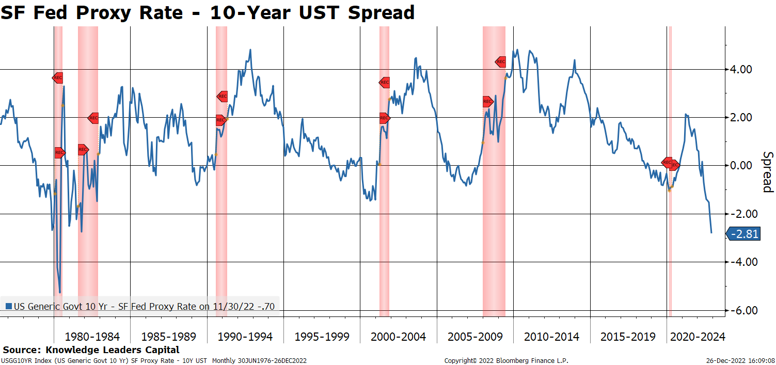
5. Using the SF Fed Proxy rate compared to the 10-year US Treasury yield, we can see a massive inversion, the likes of which hasn’t been seen since 1980.
6. This restrictive policy stance of the Federal Reserve has caused the Conference Board’s leading economic indicators to decline by 7.3% AR over the last six months. This is a recessionary level.
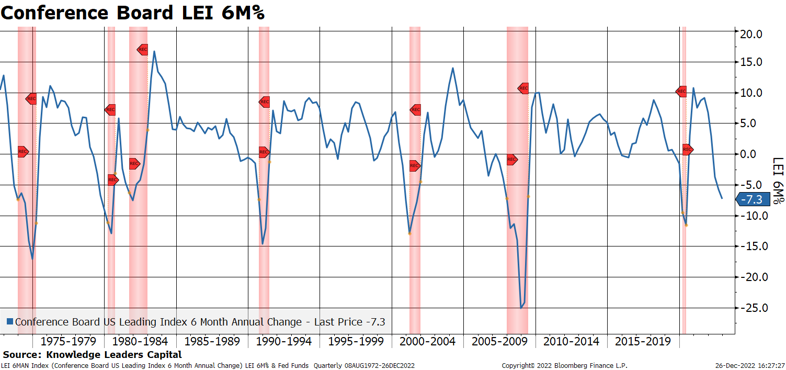
7. This explains why many forecasters are calling for a recession in 2023.
8. A rising recession probability has likely contributed to the recent drop in rates and more importantly, the drop in bond volatility.
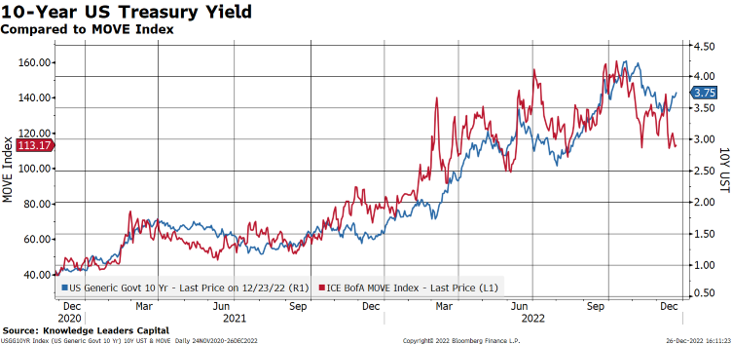
9. Bond volatility is correlated to the USD. So, falling bond volatility is leading to a dropping USD.

10. The Japanese Yen has been at the center of the recent decline in the USD. A falling USD is good for risky fixed income assets as reflected by the positive correlation to the high-yield credit default swap.

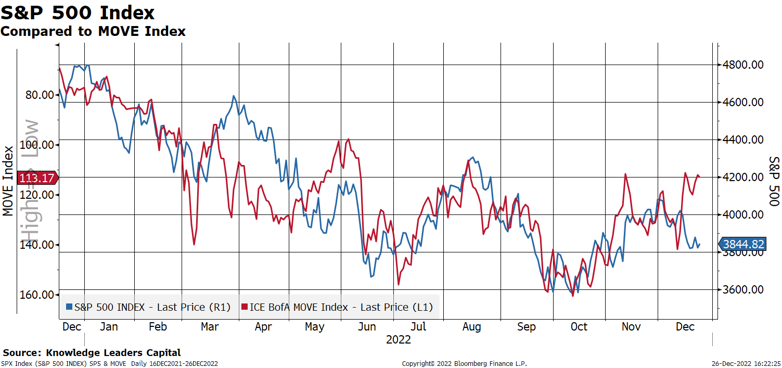
11. Falling bond volatility is also good for equity risk assets. If bond volatility keeps falling, this would seem to be a positive catalyst for stocks.
12. Which stocks to consider buying? Mean reversion anyone?

Source: Bank of America, as of 12/23/22
13. With global liquidity rising, due to a falling USD, there is a catalyst for international equities.

14. Capitalizing Intangibles Methodology
-After converting foreign currencies to the USD at the current rate, we take the top 85% of the market cap of each developed market country.
-We remove the 10% least liquid companies (by trailing 30-day average daily trading volume*price).
-We capitalize 1) research and development, and 2) other intangible investments, by removing “costs” from the income statement and recategorizing them as investments on the cash flow statement and then assets on the balance sheet.
-We record a non-cash charge on the income statement that reflects amortization of intangible capital.
-All intangible assets are carried at amortized historic cost, rather than market value.
-All data is from Factset’s fundamental database and our own proprietary database of intangible-adjusted financial statements that we maintain.
-Our intangible-adjusted data drives our investment process and informs our security analysis.
-In this analysis we will focus on the developed world equity markets.
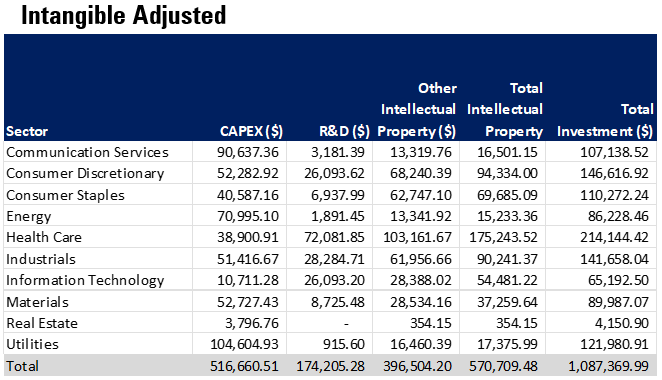
15. North America is dominated by the US. It is the largest intangible capital spending region in the world.

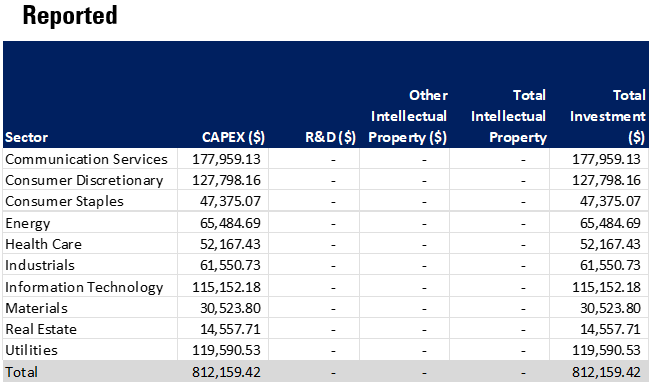
In this analysis, we are going to focus on non-financial companies. So, the total number of companies in the top 85% of market cap, with our liquidity filter, is 482 companies, with an average market cap of $65.3 billion.
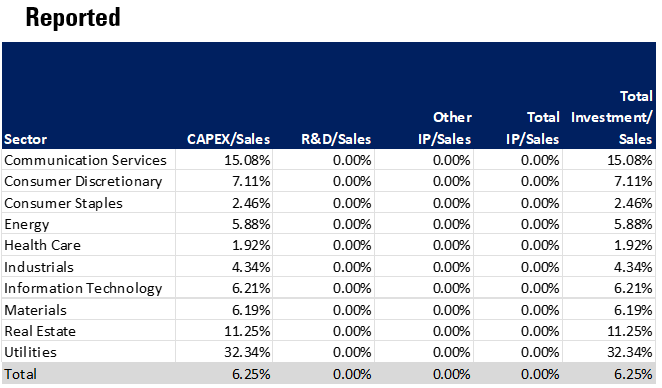
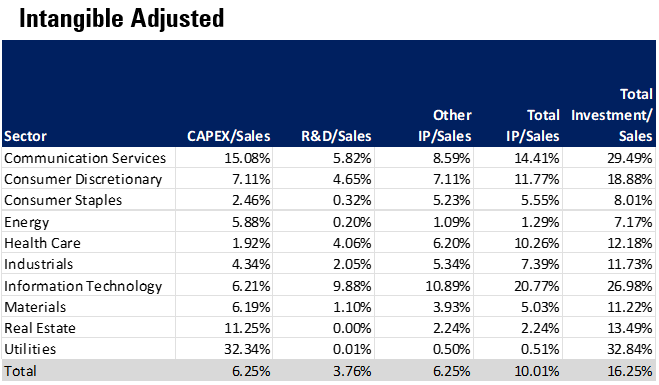
16. On a reported basis, the aggregate capital investment for North American companies is $812.2 billion. However, when we include investments in research and development and other intangible assets (advertising, brand development, employee training, etc.), total capital investment is twice as large at $2.1 trillion.

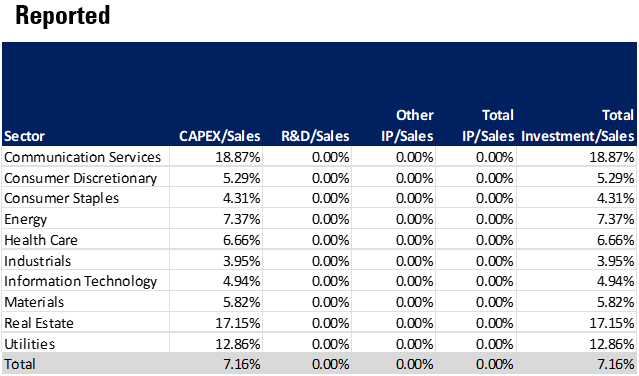
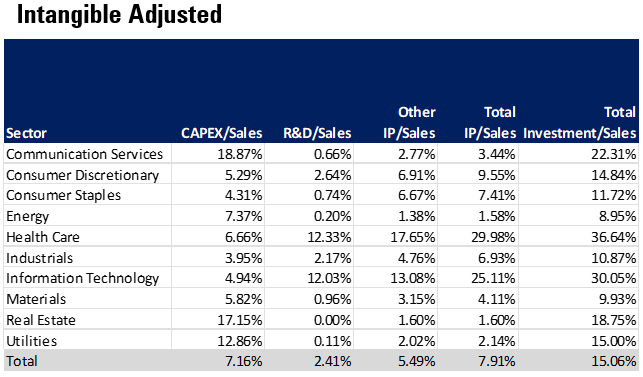
17. When we consider capital investment relative to sales, on a reported basis, North American companies total capital investment as a % of sales is 6.25%. When we consider our intangible investments, capital intensity is 16.25%, of which 10% is intangible capital investment.
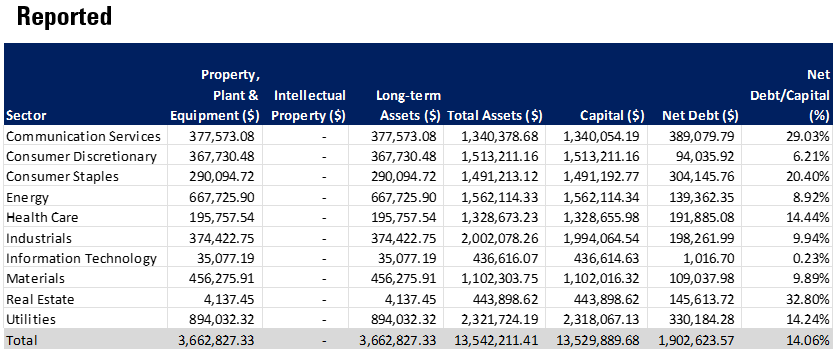
18. North American companies have about $2.3 trillion in intellectual property.

On a reported basis, intangible assets are invisible, so it would seem companies have zero intellectual property beyond patents and other specifically protected intellectual property.
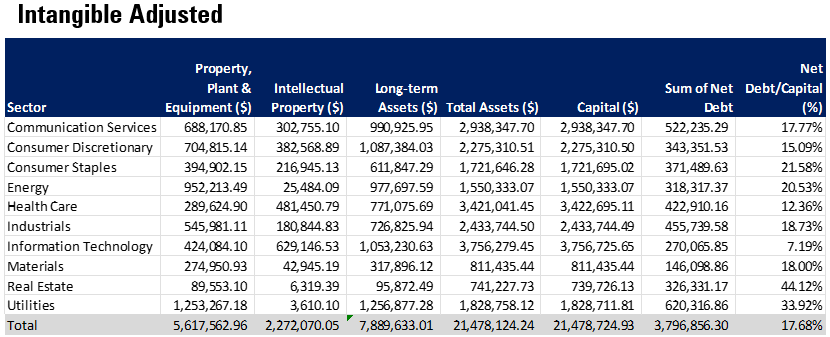
In our intangible-adjusted methodology, North American companies hold roughly $2.7 intangible assets. This boosts both long-term and total assets by a commensurate amount. The technology sector alone holds $629 billion in IP.
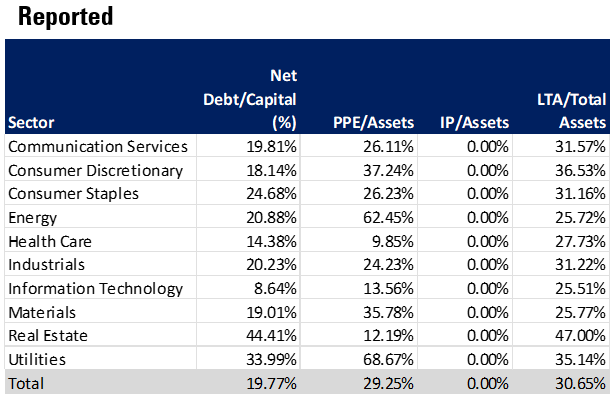
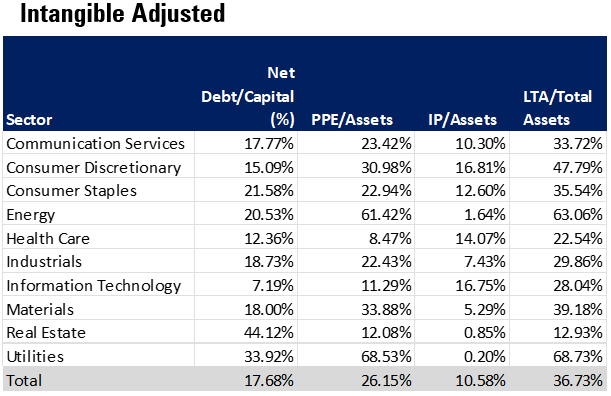
19. On a reported basis, North American companies hold long-term assets that represent 30.65% of total assets. When we include intangible assets, long-term assets as a percent of total assets increases to 36.7% of total assets. Intellectual property alone represents 10.6% of total assets.
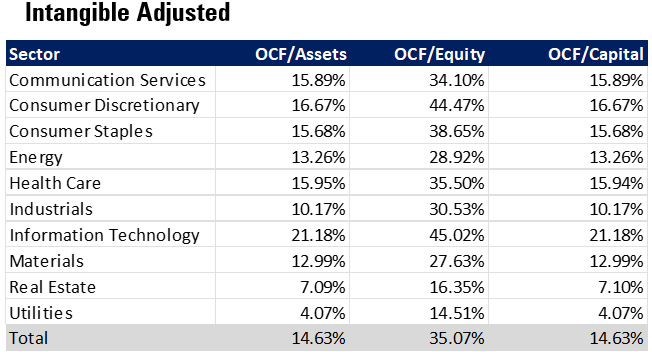
20. Considering corporate margins reveals the higher level of profitability that companies exhibit using our method. On a reported basis, North American companies generate 16.27% operating cash flow margins. On our adjusted basis, OCF margins are 24.2%. Our method highlights the greater efficiency of intangible-rich companies.


21. Reported profitability is understated. Using our method, operating cash flow-based profitability measures are about 3-4% higher across metrics. Even though companies employ more capital in our method, they generate proportionally more cash flow, thereby leading to elevated profitability ratios.

22. It all comes into play when we think about valuations.

On a reported basis, North American stocks sell for 15.9x operating cash flow and 5x book value. By any objective measure these are elevated valuations.

On an adjusted basis, North American companies sell for 10.7x cash flow and 3.76x book value. The sectors that spend the most on intangibles and have the highest margins sell at the greatest discount to reported valuations.
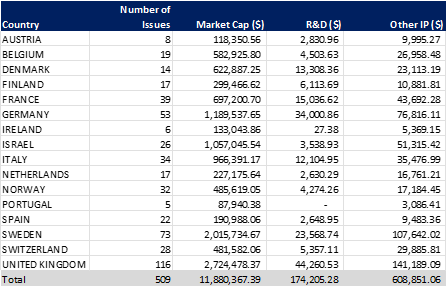
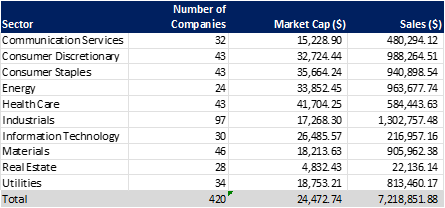
23. Europe is a much more diverse group of stocks than in the US. There are slightly fewer stocks than North America in the top 85% of market cap of each country. Ex-Financials, the total market cap is $11.9 trillion; the average market cap is about $24.5 billion and represents $7.2 trillion in sales. In aggregate, European companies invested about $775 billion in intellectual property. The European industrial sector generates almost as much sales as the US, and the materials sectors generates almost 2.5x the sales of the US.
24. On a reported basis, Europe invests just $300 billion less than US. But, when we add in the $570 billion in intangible investment, total capital investment is about half the US, at $1.1 trillion.

25. Calibrating capital investment by sales, European companies are slightly less capital intensive on a reported basis. Intellectual property investments amount to just under 8% of sales, and total capital investment is 15.1%, just slightly less than the 16.3% in North America.
26. European companies have $978 billion in intellectual property.
On a reported basis, European companies hold long-term assets of $3.7 trillion and total assets of $15.5 trillion. Debt as a percent of capital is about 5% below North America levels.
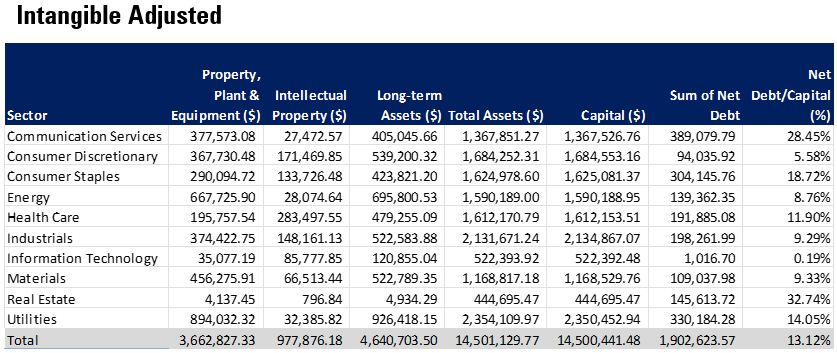
On an adjusted basis, we can see the $977 billion in intellectual property, boosting long-term assets to $4.6 trillion and total assets to $14.5 trillion. Debt levels are about 1% lower as a percent of capital than on a reported basis.
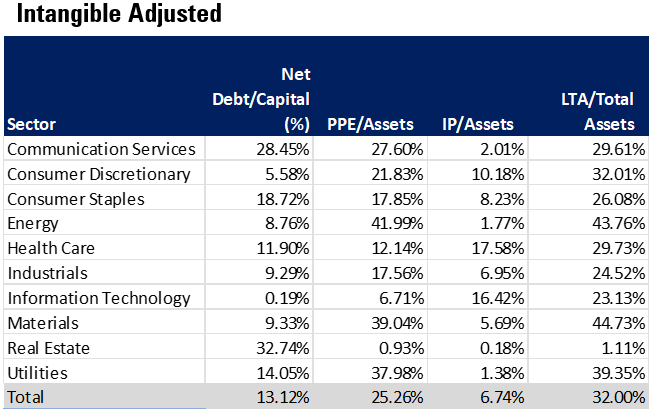
27. Adjusting asset categories by total assets, we can see that on a reported basis, Europe has 2% less PPE/Assets than the North America. On an adjusted basis, intellectual property is 6.7% of total assets, and long-term assets are 32% of total assets. These ratios are about 3-4% lower than the US.

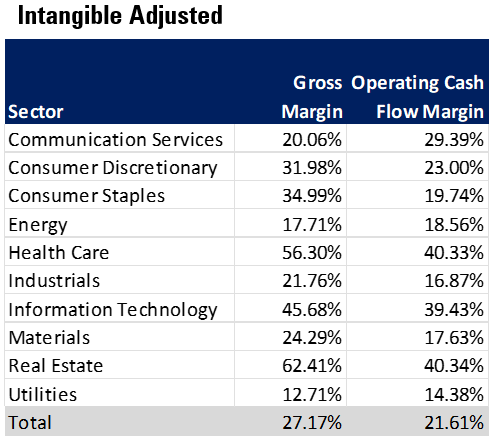
28. While gross margins are about 4% below North American levels, the operating cash flow margin is almost identical to North America. On an adjusted basis, the operating cash flow margin rises to 21.6%. The European consumer sectors and health care sector generate higher OCF margins than North America.

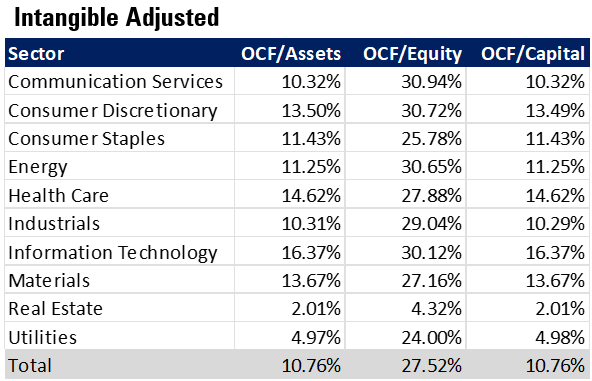
29. Reported profitability is several percentage points lower than North America. The materials sector stands out as more profitable than North America.

30. Intangible adjusted valuations are 6.8x cash flow and 1.8x book value.

On a reported basis valuations are lower than North America by about 45%. Price to book value is less than half North America.
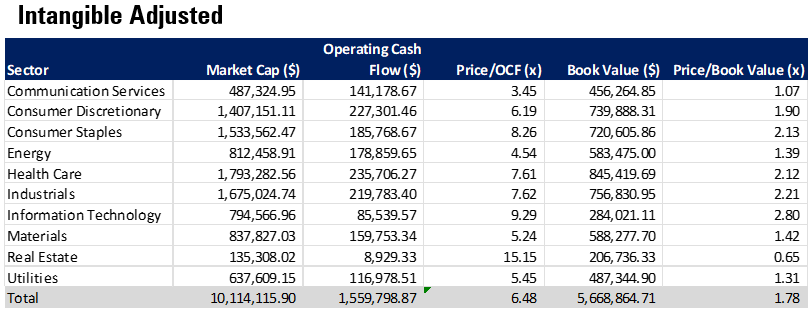
On an intangible-adjusted basis, price/cash flow is 6.48x and price/book value is 1.78x. These valuations are 40% lower than North America.
31. Developed Asia is home to more companies in the top 85% of market cap than North America. Ex-Financials there are roughly 50 more companies. Japan dominates the opportunity set. Developed Asia’s industrial sector generates the most revenues of any region in the world.
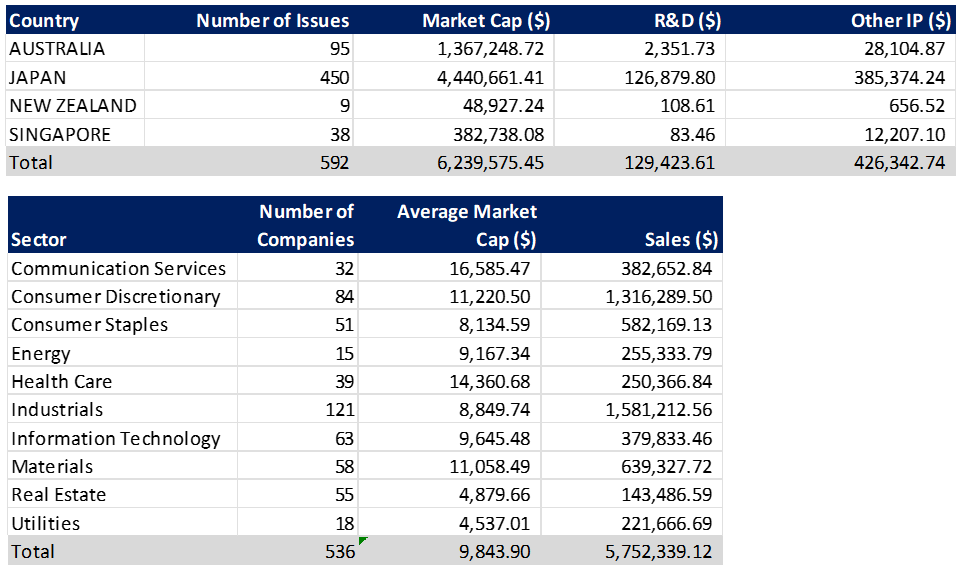
32. On a reported basis, Asian companies invested $379 billion in capital expenditures. But they also invested another $453 billion in intellectual property, bringing total capital investment to $832 billion.


33. The Asian CAPEX/Sales ratio is higher than North America. At 7.88%, Asia’s total IP investment as a percent of sales is higher than Europe-driven investment in other intellectual property besides R&D. The Developed Asian health care sector has an IP intensity (IP/Sales) almost twice that of North America.


34. Asian companies have $782 billion in intellectual property.

On a reported basis, developed Asian companies hold $2.6 trillion in long-term assets and $9.2 trillion in total assets. They have the lowest net debt levels of any region.
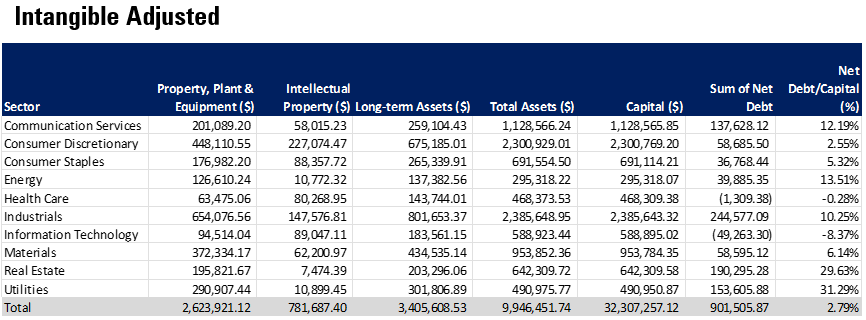
On an adjusted basis, Asian companies hold $781 billion in intellectual property and maintain a low leverage ratio of only 2.79% net debt/capital.
35. Asian companies employ more property, plant and equipment/sales on an adjusted basis than North America. However, as a percent of assets, they have several percentage points less in IP and long-term assets than North America. Asian health care companies have a greater percent of IP/assets than do North American.


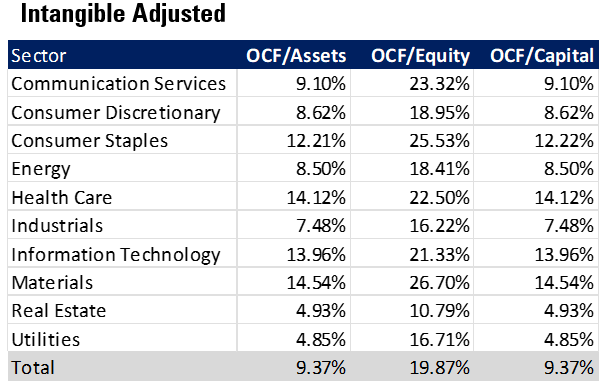
36. Margins are structurally lower in Asia than North America or Europe. The consumer staples and health sectors are the outliers, posting higher OCF margins than North America.


37. Profitability levels are structurally lower than North America on both a reported and adjusted basis. Nevertheless, on an adjusted basis OCF based return on equity was still almost 20%.

38. Finally, valuations for developed Asian companies are 40% cheaper than North American companies.

On a reported basis, developed Asian companies sell for 8.8x cash flow and 1.2x book value. Two sectors sell for a discount to reported book value.

On an adjusted basis, five sectors sell for below book value. Even the most expensive sector using price/book value is still half that of North America. In aggregate, Asia sells for a slight 2% premium to book value making it by far the cheapest region in the world. This is a 70% discount to North America.
39. Conclusions – Take the best parts from each region.
The developed markets opportunity set is large, covering more than 1,500 companies. Of which, roughly two-thirds are outside North America. At $38.9 trillion, the market cap of North America is roughly twice that of the international universe of $18.1 trillion. The average North American company is a behemoth compared to its international peers. The average market cap in North America—which is dominated by US companies—is $65.3 billion, while the average market cap is merely $24.5 billion in Europe and $9.8 billion in Asia. North American companies generate $13 trillion in sales, matching the $13 trillion in combined sales in Europe and Asia. North American companies have $1.3 trillion in intellectual property by our methodology. Combined, Europe and Asia have $1 trillion in intellectual property.
Operating cash flow margins in North American companies are slightly higher—with a few sectoral exceptions– than those in Europe or developed Asia. Europe offers the best operating cash flow margins in the consumer staples, consumer discretionary and health care sectors. Asia offers the world’s highest operating cash flow margins for materials companies.
North America also holds the crown for the most expensive market in the developed markets, selling for 10.7x cash flow and 3.76x book value using our intangible-adjusted financial data. Europe sells for a 40% discount to North American metrics while Asia sells for 1.02x book value—a 70% discount to North America. Of note, in Asia, there are five sectors that trade below book value.
All in all, relative value rests outside North America even though many North American sectors outperform international sectors along a variety of metrics. The North American technology sector stands out among global peers as the most IP-intensive and profitable, and accounts for almost 20% of global R&D investment, spending more on R&D than the entirety of Europe. But North America also carries $1 trillion more in net debt than the combined European and Asian markets.
At the end of the day, the choice isn’t between North America and the rest of world. Rather it is about identifying the best parts of each region’s stock markets. In Europe the consumer, industrial and materials sectors are cheaper, and we think offer good opportunities. In Asia, the health care sector is the most innovative in the world, while the entire market sells for a slim 2% premium to book value. The region also generates the most revenues from the industrial sector in the world, and its material sector is the most IP intensive in the world. We believe investing in global strategies is the most effective way to capture portfolio alpha.
Prefer to download this presentation in PDF? Please click here.
Disclosures
Unless otherwise noted, tables and data source is Factset, Knowledge Leaders Capital, as of 12/16/22
The Morningstar Developed Markets Large-Mid Cap Index is a subset of large-cap and mid-cap stocks in the Morningstar Developed Markets Index, a broad market Index representing 97% of Developed Markets equity market capitalization.
Knowledge Leaders Capital identifies Knowledge Leaders, or highly innovative companies, by measuring a company’s investment in its future growth. Knowledge Leaders possess deep reservoirs of intangible capital as a result of their history of investing in knowledge-intensive activities like R&D, brand development and employee education. Developed by founder Steven Vannelli and based on decades of academic research, our proprietary model adjusts a company’s financial history to capitalize these investments and reveal the companies with the greatest knowledge intensity. The companies that pass our quantitative screen are identified as Knowledge Leaders.
The information contained herein is provided for informational purposes only and should not be regarded as an offer to sell or a solicitation of an offer to buy the securities or products mentioned, nor should it be regarded as investment, tax or legal advice. Please consult an appropriate professional advisor for advice specific to your situation. Knowledge Leaders Capital may deviate from the opinions, investments, or strategy implementation as discussed in this presentation. The strategies discussed in the presentation may not be suitable for all investors. Knowledge Leaders Capital makes no representations that the contents are appropriate for use in all locations, or that the transactions, securities, products, instruments, or services discussed are available or appropriate for sale or use in all jurisdictions or countries, or by all investors or counterparties.
An investor cannot invest directly in an index.
Past performance or historical trends are not indicative of future results.
