An Unconventional Way Of Looking At Valuations
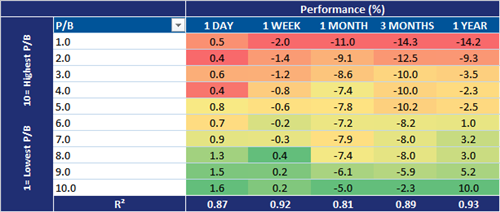
An unconventional way of looking at valuations is to place companies into different ”buckets” based on their absolutely valuation level....
We have had a small pickup in volatility in the equity markets since October....
The median year-to-date performance in the MSCI World Index with two weeks of trading left is -1%. The median stock was up 20% at this point last year and was up 13% at this point in 2012. The developed country with the worst median performance...
The MSCI World Index is only about 6% of it’s 200-day high as of the close yesterday. However, 55% of the stocks in the index are down at least 10% and 30% of the stocks in the index are currently in a bear market (down...
In June, 86% of the energy stocks in the MSCI World Index had positive price performance year-to-date. Since that time, however, energy stocks have been clobbered. In mid-October, only 11% of energy stocks were higher YTD. This has marginally improved to 28% as of yesterday....
As we have noted many times before, a simple way of measuring momentum is by looking at the percentage of companies that have a 50-day moving average above its 200-day moving average. Robust bull moves tend to have a rising percentage of stocks where the...
Somewhat surprisingly, the percentage of stocks that outperform the MSCI World Index over a short-term horizon, say 200 days, stays in a fairly tight range of approximately 40-60% in general. Currently, only 45% of stocks in the MSCI World Index have managed to outperformed the...
Over the last month, ROE has moved to the top of the list of factors that influence returns in the MSCI World Index: While this was also the most important driver in Europe, it did not even make it into the top five for the...
As we have mentioned before, each month we score companies’ technical strength relative to the benchmark. Since a year ago, the average score for European and, to a lesser extent, North American companies has declined....
Of our 30 factors, Dividend Yield and 1-month and 3-month change in EPS estimates had the highest r-squared value to market performance last week (figure 1)....
We have recently commented on how sales and earnings estimate revisions have been in a decline (here and here). Today, we wanted to look at just what kind of growth rates are imbedded in those falling estimates....
The energy sector has been the hardest hit sector over the past month as well as over the past year. On an equal-weighted basis, the energy sector is down 14.7% over the past month and down 9.7% over the past year....
The percent of stocks with positive performance for the month of October through last Friday stands at a paltry 15%. Granted, as of last Friday there were ten trading days left in the month, but 15% would the lowest reading since May of 2012 and...
One of the ways we like to dissect equity performance is by taking a valuation factor, such as the price-to-book ratio, and analyzing how the performance of the lowest (i.e. cheapest) price-to-book stocks have performed relative to the performance of the highest (i.e. most expensive)...
Even as stock prices have corrected in recent weeks with only 36% of stocks having positive performance over the last 200 days and the average stock 19% from its one year high, we are reminded that stock valuations are still stretched pretty much everywhere....