MSCI World Tag

Is LKQ Corp’s Run Finally Over?

21 Jan, by Knowledge Leaders Team in Uncategorized

LKQ is up nearly 180% over the past four years for an impressive 100% greater gain than the MSCI World during that time. However, the stock has shown some distribution problems recently as it has underperformed the MSCI World index by nearly 20% over the...

Last Week’s Winners and Losers

13 Jan, by Knowledge Leaders Team in Uncategorized

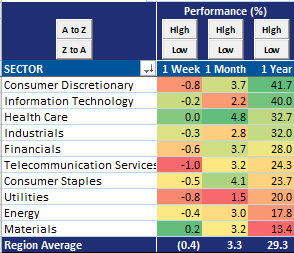
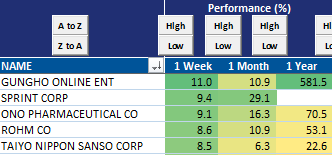
As we frequently like do here, it’s useful to look back at last week’s major winners and losers from a sector view all the way down to individual stocks. Below are the best and the worst of the MSCI World Index from last week....

Weak YTD Returns Are Not Just a US Phenomenon

08 Jan, by Knowledge Leaders Team in Uncategorized

The weak start to the year for the domestic stock market has been getting all the press, but the truth is that returns have been lackluster pretty much everywhere. Below we show the equally weighted performance by country for all developed markets and note that...

Who Won and Loss The Holiday Week

30 Dec, by Knowledge Leaders Team in Uncategorized

Let’s take a quick tour of who had the best and worst performance in the light trading week last week. We will start bottom-up and work our way up to the aggregates (and as usual all aggregate data is equal-weighted)....

Last Week’s Returns Had “Risk-On” Characteristics

23 Dec, by Knowledge Leaders Team in Uncategorized

Last week, the two factors with the highest R-squared to the market were correlation with the Yen and beta. Interestingly, there has been a very clear relationship when looking at stocks with high or low correlation with the Yen over the past year....

Yen Weakness Drove Market Last Week

02 Dec, by Knowledge Leaders Team in Uncategorized

Over the past quarter, the Yen was weakened by about 5% while the MSCI World is up about 5.5%. This relationship continued last week as the factor with the highest r-squared to MSCI World stock performance was yen correlation. The factor with the lowest r-squared...

Scoreboard Check

18 Nov, by Knowledge Leaders Team in Uncategorized

On an equally weighted basis, the average stock last week was up 1.8% in the MSCI World Index. 4 out of 5 of the best performing stocks came from the MSCI Pacific subset of the MSCI World Index....

What Does The Average Stock Look Like?

12 Nov, by Knowledge Leaders Team in Uncategorized

We find that it is useful at times to step back from individual stock analysis and compare sectors to understand what are the the dynamics going on in the stock market. When we look at sectors, we look at it from an ”equal-weighted” basis rather...

Finding Cheap Stocks Isn’t Easy These Days

06 Nov, by Knowledge Leaders Team in Uncategorized

Earlier today we highlighted how overbought the Telecom sector was, so we thought it only fair to mention that by some valuation metrics it is also the cheapest sector, on average. Below we show two tables of valuation breadth metrics....

Rally Like It’s 2009

24 Oct, by Knowledge Leaders Team in Uncategorized

We perform a variety of calculations to understand the often imperceptible changes in the underlying structure of the stock market.  One calculation we make is to measure the percent of stocks making a new 200-day high.  Historically this metric gets the most extended during the...

What’s Wrong With This Picture?

22 Oct, by Knowledge Leaders Team in Uncategorized

The MSCI World index is back to within 2% of an all-time high.  Meanwhile the employment to population ratio in the US is languishing at levels not seen since 1983.  In 1983, the Billboard top song was Every Breath You Take by the Police....