

Hyperbolic Discounting and Intangible Capital
October 01, 2014For most investors, investments in research and development (R&D) and investments in other intangible assets such as brand building, employee training and codified information are overlooked and misunderstood. Current business accounting standards contribute to this misunderstanding by treating intangible investments as current period expenses rather than as the capital investments they truly are. However, there is another more innate, psychological reason that investors often overlook the importance of intangible investments.
Human beings have a problem making correct intertemporal decisions. Humans, and thus investors, consistently overvalue the present value of an asset or profit (or marshmallow) while vastly undervaluing a future asset or stream of profits even if that asset or stream of profits will be realized in the very near future. Put another way, investors show a severe hyperbolic discounting bias. Many investors are scared off by companies investing heavily in R&D because they fail to recognize that by sacrificing current profits today these companies will realize greater future profits and market share in the future. Academic literature, as well as empirical data as we will highlight below, has shown that sacrificing today’s profits by investing in intangible assets can bring a windfall of growth, market share and stock price outperformance in the future. Companies that continually make the correct intertemporal decision to invest in long-lasting intangible assets are called called knowledge leaders and those that focus myopically on current period profits are knowledge followers.
In all the tables below, we are looking at MSCI industry groups, constructed on an equal-weighted basis using the MSCI World Index constituents, and we have sorted the table based on our proprietary calculation of total intangible investments. Finally, all the columns have been conditionally formatted to make trends more easily identified by the eye. The highest number in a column is green and the lowest number is red. Total intangible investment is made up of two parts: investment in R&D and investment in advertising and other firm specific resources.
In Figure 1, we are looking at whether or not higher levels of investment in intangible assets actually lead to higher growth rates of sales, EPS and cash flow on a per share basis over the previous 10-year period. Figure 2 looks at the same data except over a 20-year period. What we find is that for the most part, the industries that invest the most in intangibles have had higher 10-year growth rates (i.e. green matches up with green). For example, the Pharma, Biotech & Life Sciences industry has the highest total investment in intangible investments at 24.6% of their sales. They invest 16.4% of their sales in R&D and another 8.1% of their sales in advertising and firm specific resources. Over the past 10 years they have managed to grow sales by 12.2% yearly and cash flow by 10%. Looking at Figure 2, over the previous 20 years the Pharma, Biotech & Life Sciences industry group has managed to grow sales by 10% a year and cash flow by 9.3%. Now bring your eye to the bottom of Figure 1 and Figure 2. Utilities, Real Estate and Banks are the lowest intangible investors. It is not that surprising then to see these industry groups with some of the lowest 10-year and 20-year growth rates in sales, EPS and cash flow.
Figure 1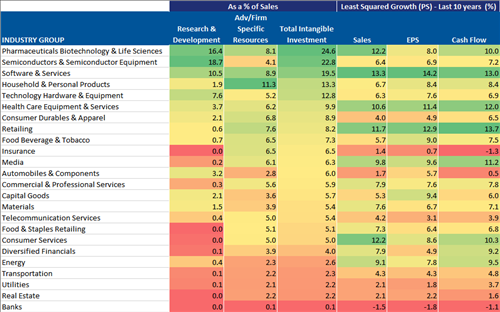
Figure 2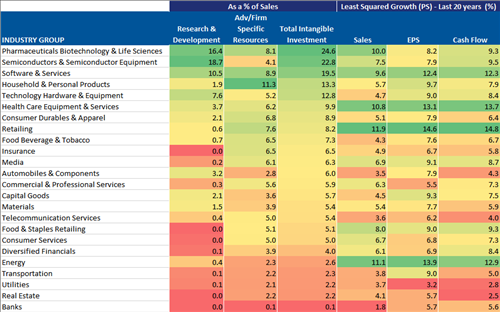
So have these high investment rates and solid historical growth rates translated into equity outperformance? The answer is yes they have over the past one and four years. The Pharma, Biotech & Life Sciences industry group has been the best performing industry out of the 24 MSCI industry groups . The second and third highest intangible investment industries have also performed well, especially over the last four years. Now, let’s move our analysis again to the bottom of the table. The lowest intangible investments industries have had the worst performance over the past four years and are some of the worst performers over the past one year.
Figure 3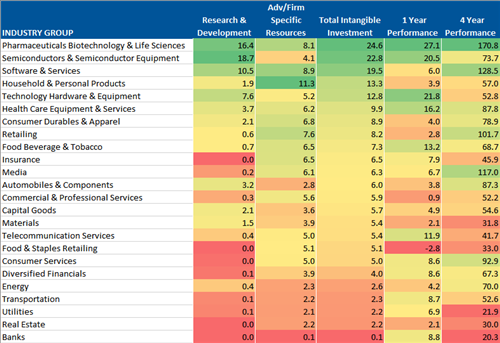
Investments in intangible assets do not lead to superior growth or outperformance overnight. If they did every company would focus on them and it would not lead to long-term competitive advantage. Instead, intangible investments, just like tangible fixed investments, must be part of a long-term organizational strategic plan to stay one step ahead of the competition. And while it is very difficult to overcome in innate bias such as hyperbolic discounting, it is to the benefit of an investor to look past current profits and understand what is driving future profits.
