Risk Management 101: Diversification (Easier Said Than Done)
June 08, 2017There are three basic ways to manage the risk of an equity portfolio:
- Diversify, by owning a collection of stocks from different industries
- Hedge, by shorting stocks or equity futures
- Buy insurance, like buying an out-of-the-money put option.
The essence of diversification is choosing assets that are not perfectly correlated with each other. The logic is simple enough: when one asset zigs, another zags. Years ago, finance scholars proved that a portfolio of securities is less risky than an individual holding and the idea of diversification as a risk management tool was born.
When I survey the landscape of US equities, it appears that there are very few opportunities for diversification. My method is simple: I look at the correlation over the last 10 years of each North American sector in our global Knowledge Leaders Selection Universe (KLSU) indexes. Our indexes are constructed by taking the largest 85% of the market cap of a country, so they are representative of mid/large cap performance.
Starting with the consumer sectors, it is amazing to see a 98% correlation. Now the consumer discretionary sector outperformed the broader North American equity market, but I am not so concerned with relative performance in this exercise. Rather, I am interested in identifying sectors that can add diversification to a portfolio. Clearly there is little portfolio diversification owning discretionary shares.

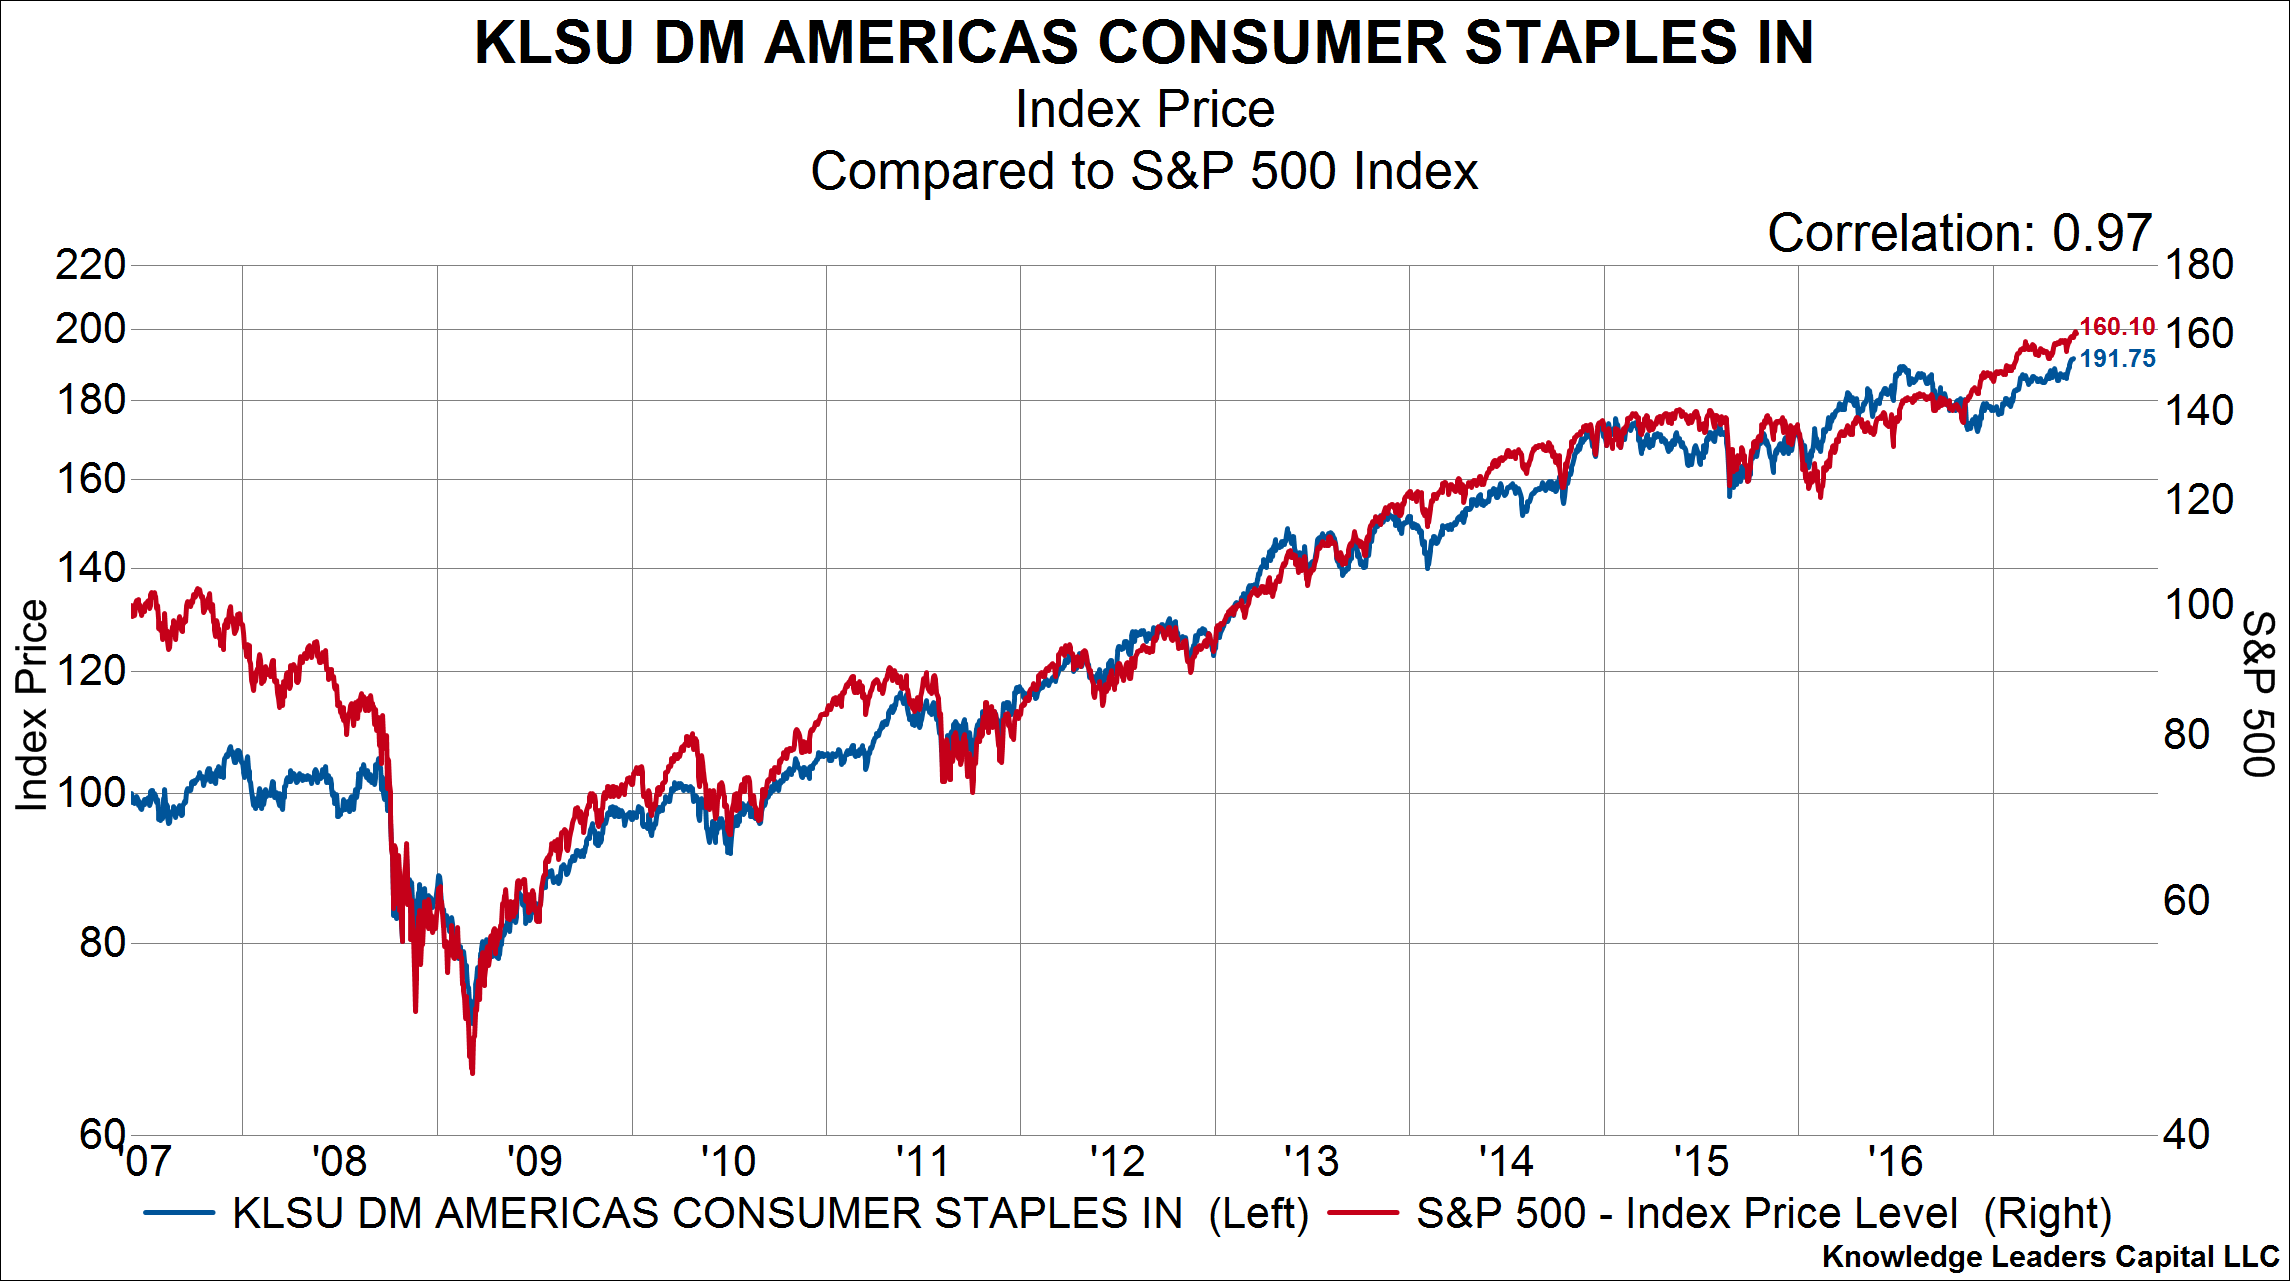
Same story when I look at the consumer staples sector. It has a 97% correlation with the S&P 500 over the last decade.
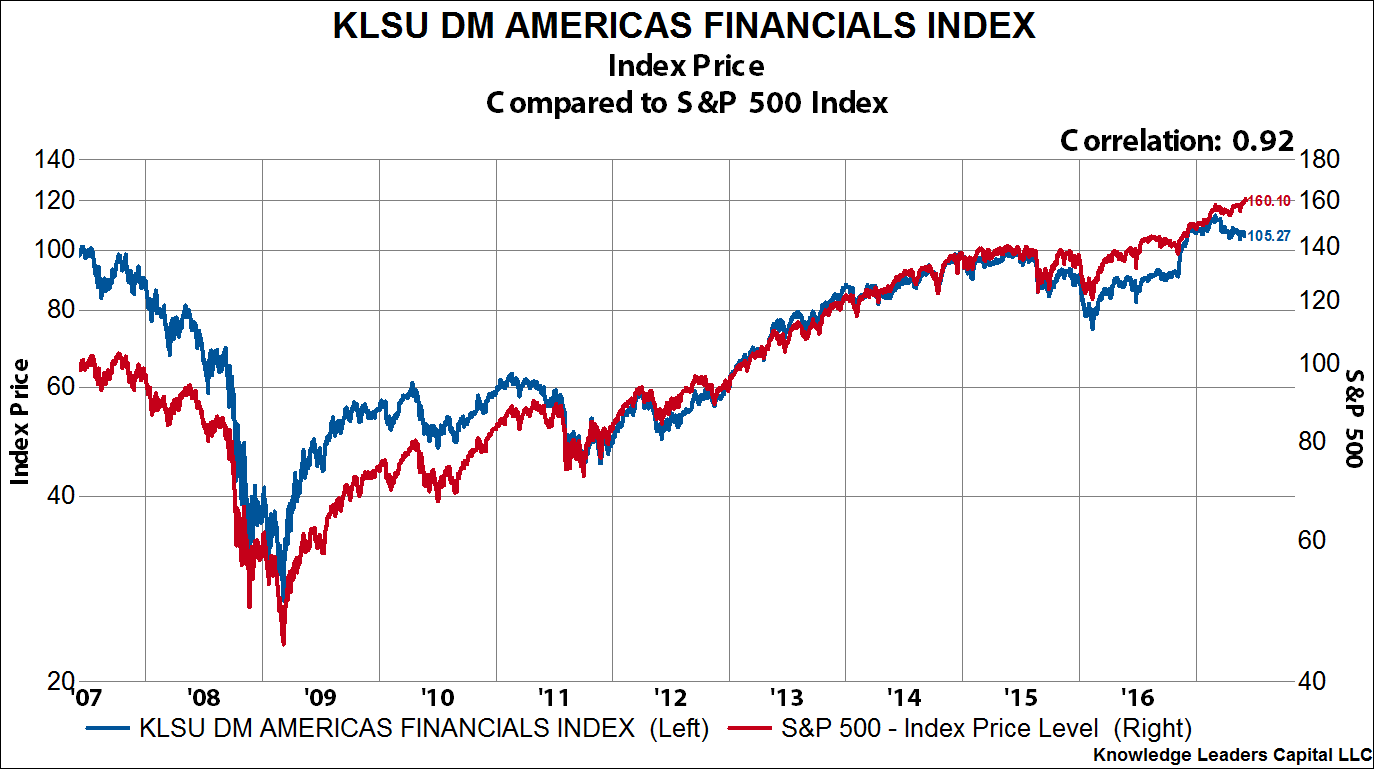
Next is the financial sector, where again we see very high correlations. The North American financial sector has a 92% correlation with the S&P 500.
On to health care next. Again, I see little diversification benefits to a sector that is 97% correlated with the S&P 500.

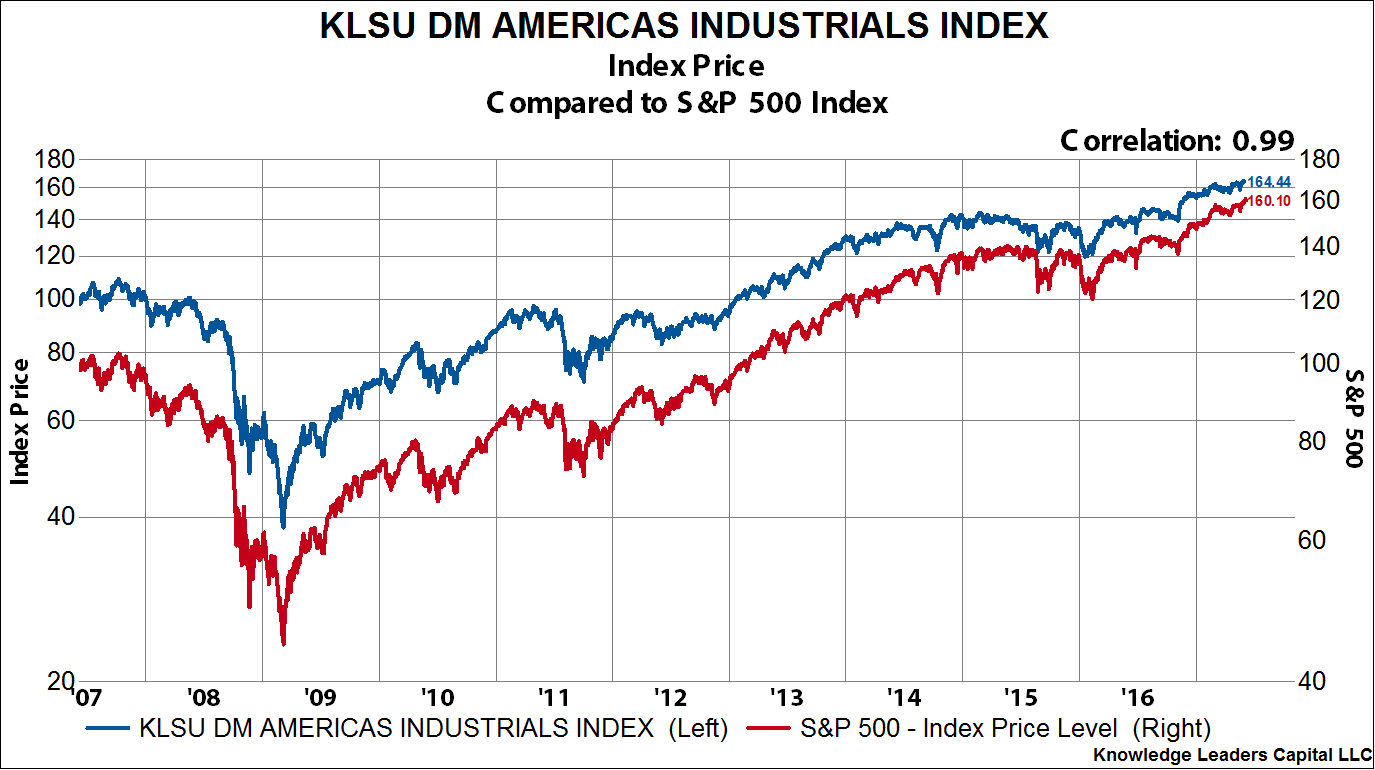
The industrial sector takes the cake for the sector with the highest correlation to the S&P 500. It has an amazing 99% correlation over the last decade. No diversification here.
Closely behind the industrial sector is the technology sector, with a trailing 10 year correlation of 98%.

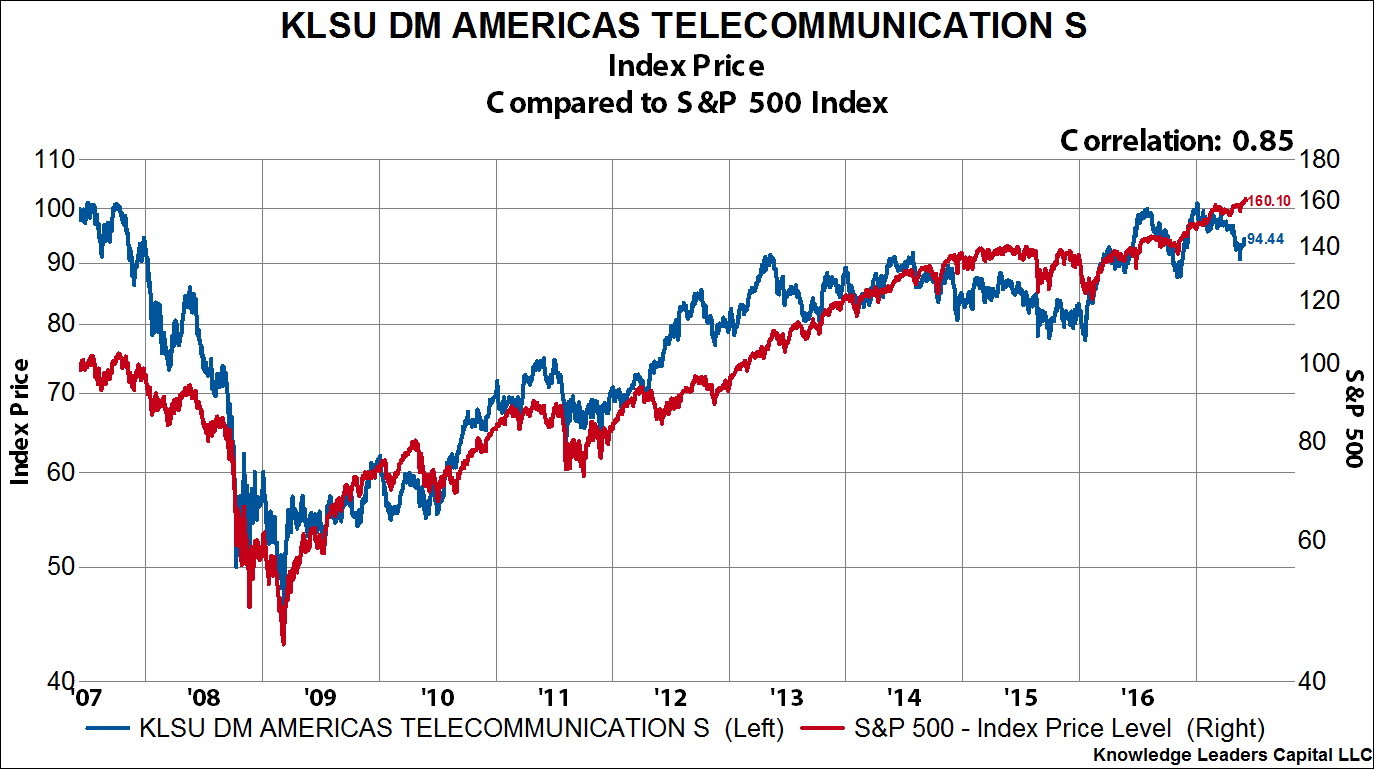
Even the staid telecom sector has an 85% correlation with the S&P 500 over the last decade.
To summarize so far:
- Diversification is the most basic risk management tool available to investors, but it requires assets with low correlations to work.
- 8 out of 10 sectors in North America have a correlation to the S&P 500 over 80%.
- 7 out of 10 sectors in North America have a correlation to the S&P 500 over 90%.
- 5 out of 10 sectors in North America have a correlation to the S&P 500 over 97%.
- No wonder investors are simply putting money in the S&P 500 ETF. Set it and forget it!
- The relative new terms “risk on” and “risk off” are fairly descriptive when 8 out of 10 sectors move almost in perfect unison with the market.
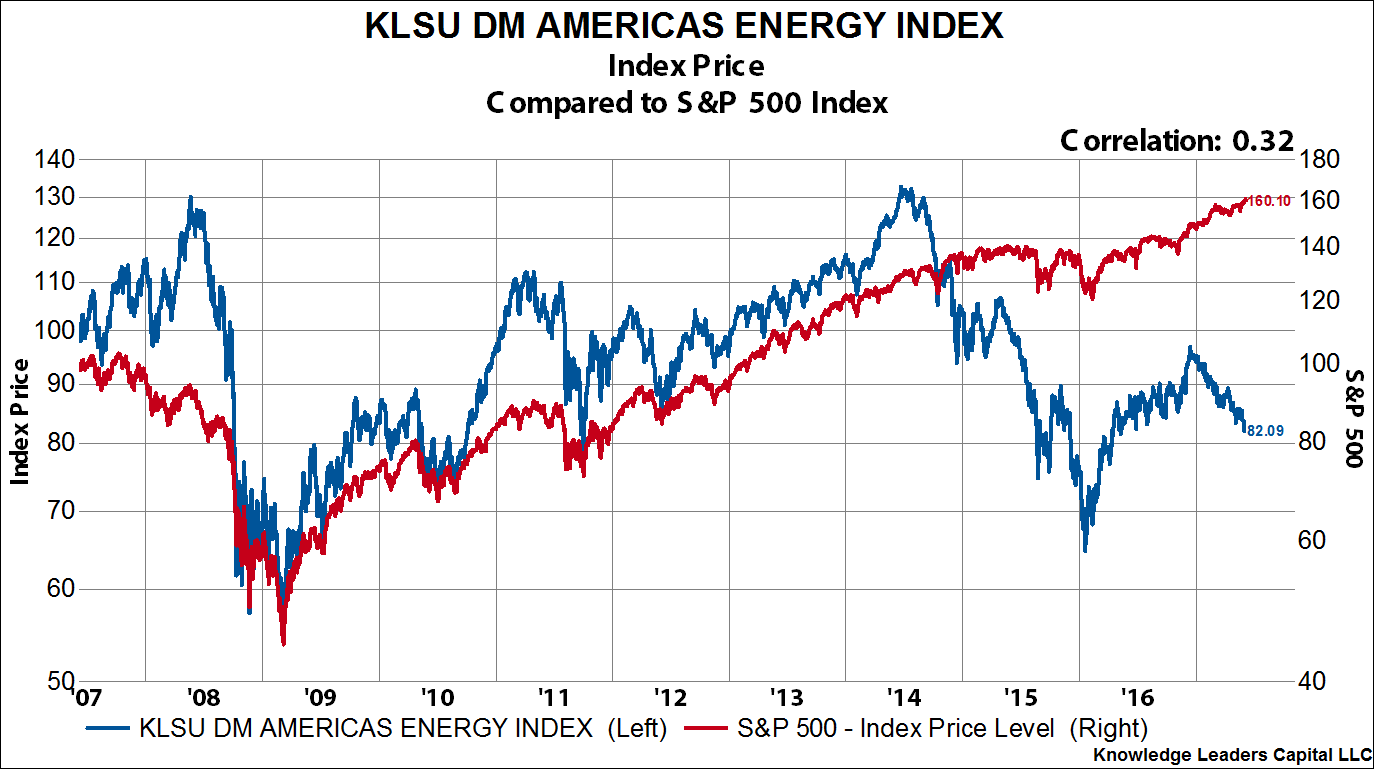
For those still pursuing active asset allocation, there are 2 sectors in North America that should come into focus. The energy sector has the lowest correlation to the S&P 500 of any sector. Over the last decade, the sector only has a 32% correlation with the S&P 500. This means the S&P only explained about 9% of the movements of energy stocks (the r-squared). With correlations this low, energy shares are an effective diversifier.
The sector with the next lowest correlation is the basic materials sector. Here the correlation over the last decade is somewhat higher than energy at 50%, which means the S&P 500 explained about 25% of the returns in the materials sector (r-squared). But still, the sector is really driven by idiosyncratic features like the price of copper or polyethylene.

The take-away for all those that practice diversification as a risk management tool is that the resources sectors are really the only sources of diversification in the US equity market right now. While a portfolio with a good allocation to resources is likely underperforming the benchmark this year, if/when the US equity market experiences another bout of “risk off”, these areas should bolster portfolio performance.
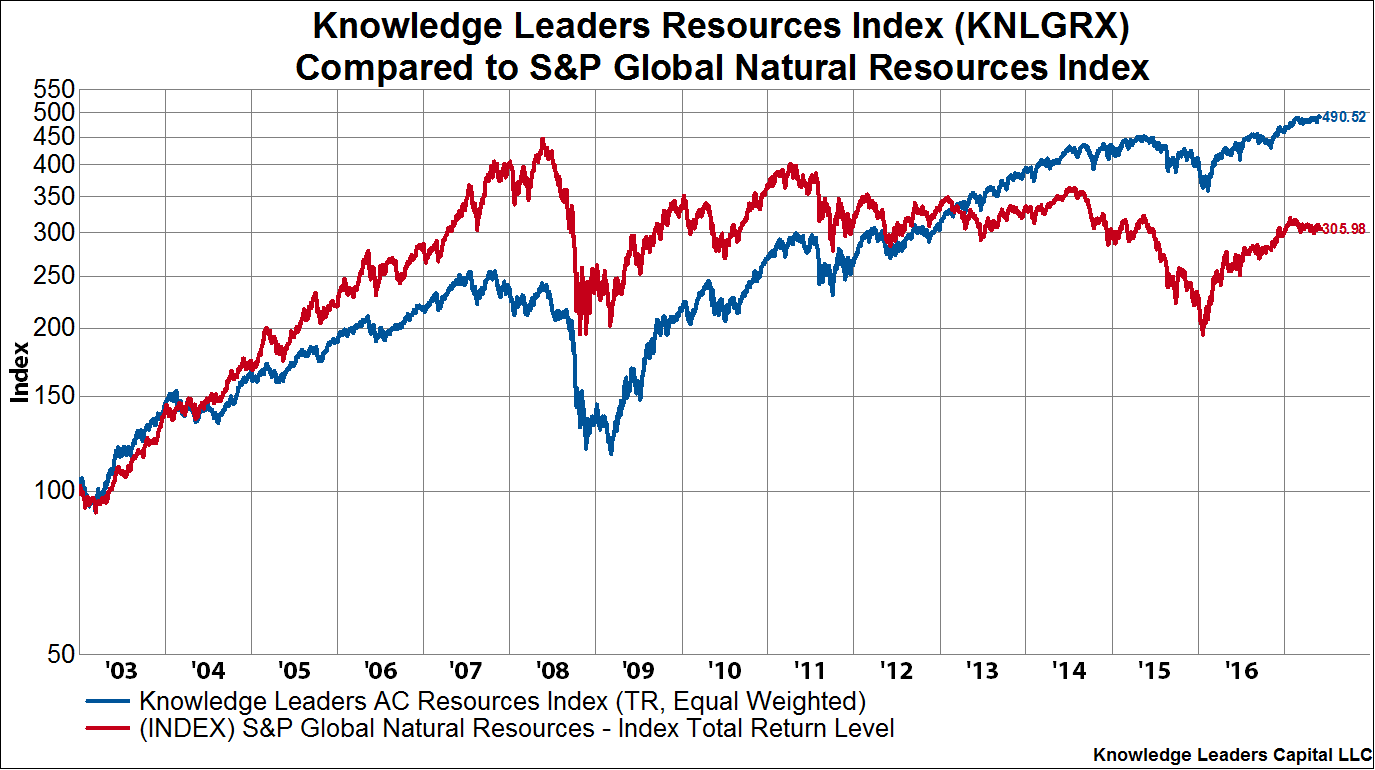
It is for this reason that we created the Knowledge Leaders Global Resources Index (KNLGRX). Recognizing that eight years into a stock market recovery (without a more than 20% correction), we should be very attuned to risk management. Below, we chart the performance of our resources index against the S&P Global Resources Index. We attribute the outperformance of our index to the selection methodology, where we only include stocks that meet our minimum thresholds for intellectual property investments and profitability. Knowledge Leader resource companies have outperformed their peers by a wide margin over the last decade. So, if one is looking to add resource stocks to one’s portfolio to improve diversification, the Knowledge Leaders Global Resource Index is a good place to start.