

Why is the U.S. Market Trouncing Canada Year-to-Date?
February 08, 2023So far this year, American stocks have outperformed Canadian stocks. In this post I’ll look at recent performance of equities in the U.S. and Canada to understand what drove the difference between the two countries’ equity performance year-to-date.
For this analysis, I start by taking the top 85% of companies from both countries by market cap and then filtering for large and mid-cap stocks in Canada and the United States. This gives us 1,104 companies in the United States and 204 companies in Canada. Note that all tables in this presentation show results on an equal-weight basis to show sector performance without the effects of cap size. In the next three tables below, I show performance on average for both countries together and then contrast the performance between both countries.
For Canada and the U.S. so far this year, stocks in the previously beaten down information technology, communication services, and consumer discretionary sectors have made a resounding comeback, beating the traditionally value-orientated defensive stocks like energy, consumer staples and utilities. The first table here shows the average performance year-to-date between the two counties that make up our Developed Market Americas Mid-Large universe.
Performance of DM Americas (%):

DM Americas (Canada and U.S.) equities increased in value on average 8.92% year-to-date.
Performance of U.S. (%):

But, U.S. Mid-Large Cap stocks returned more at 9.30%.
Performance of Canada (%):

Mid-to-Large Cap Canadian stocks increased in value by just 6.86% over the same period. So, on average U.S. companies beat Canadian ones by 2.44%. Why the outperformance of U.S. stocks? The reason is sector composition. Below, I break down sector composition by country.
Number of United States Mid-Large Stocks by Sector:
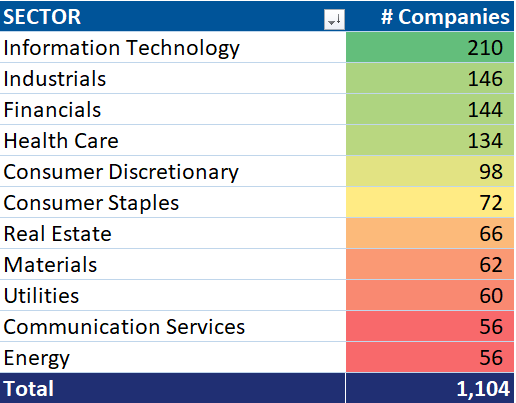
Out of the previously mentioned 1,104 Mid-Large Cap companies in the United States, 210 (19%) are technology companies, followed by industrials and financials, which have been better performers than energy, utilities and consumer staples this year.
Number of Canada Mid-Large Stocks by Sector:

This is in strong contrast to Canada’s paltry 10 technology Mid-Large Cap companies that passed our initial market cap filter, representing just 5% of all Canadian companies. Canada has a sector composition that is almost a mirror image of the United States, with many fewer technology, consumer discretionary and communication companies. Canada also has a higher percentage of energy and utility companies, which are sectors that have underperformed this year. Canada has 3x as many energy companies (15%) in terms of percentage sector composition, which is a sector that has had a rough start to 2023 after a banner year in 2022.
Since the United States’ equity market is composed of more technology and growth-oriented companies, it has had a larger percentage of outperforming companies compared with Canada this year so far. Therefore, sector composition is behind the U.S. outperformance as it is more heavily oriented toward growth sectors like information technology, which contrasts sharply with Canada’s value-oriented sector composition.
