

Tour of the Global Equity Markets
June 03, 2022Please find below our Mid-Quarter Update: Tour of the Global Equity Markets.
Prefer to download this presentation in PDF? Please click here.
1. Summary
We have a very precise methodology for dissecting the world’s equity markets. We take:
1)The top 85% of the market cap of each country.
2)We convert all prices to USD from local.
3)We eliminate any stock trading less than $1/share.
4)We eliminate the 10% least liquid developed market stocks and 50% of the least liquid emerging market stocks.
5)We equal-weight stocks into various different aggregates.
For the resulting universe of stocks, we convert their financials employing our proprietary intangible-adjusted methodology, where we capitalize all intangible investments. These resulting intangible adjustments impact flows, like cash flow, and levels like book value.
In the following analysis we dissect the global equity market in an attempt to uncover investment opportunities. In reality, this is a continuous process for us, but we thought sharing our data and insights would be helpful for investors to understand how we invest.
Japanese consumer staples stand out from our work as a good place to consider deploying capital given what we believe to be bargain valuations.
2. Number of companies per country.
In the developed markets, we track 1,987 mid and large-cap companies covering 22 countries.

In the emerging markets, we track 1,156 mid and large-cap companies covering 20 countries. We do not track Chinese companies traded in China, only those traded in Hong Kong.

3. Year-to-date, emerging markets on average have performed better than developed markets. Ten emerging markets have experienced positive returns, while only two developed markets have.


4. All but three emerging market countries have outperformed the Morningstar Developed Markets Large-Mid Cap Index year-to-date. Only eight developed countries have outperformed.


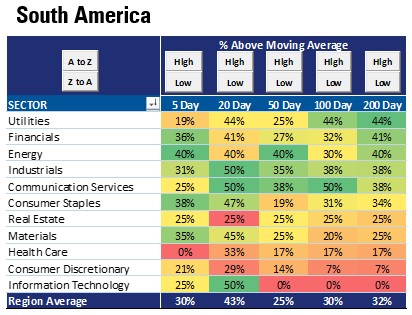
5. Emerging market internals are generally in better shape than developed markets. Across every time dimension we track, the percentage of stocks above their moving average is higher in the emerging markets.


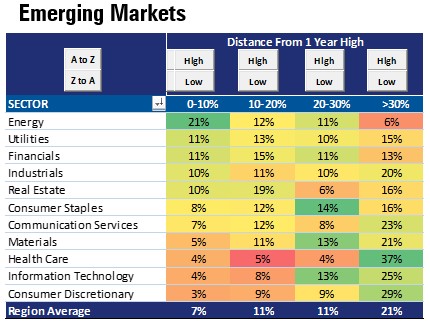
6. Interestingly, the percent of companies in a correction (-10% to -20%) and those in a bear market (-20%+) are roughly the same for both geographies.


7. Using our intangible-adjusted methodology, there isn’t a huge dispersion in the breakdown of developed and emerging markets companies in various price/cash flow buckets. In the emerging markets, there are more stocks that trade at less than 5x cash flow and more stocks that trade at 25x+ cash flow than in the developed markets.


8. Broadly, the emerging markets could offer greater earnings growth in the next four years per current consensus estimates.


9. In general, dividend yields are higher in the emerging markets, while the payout ratio is much lower than in the developed markets. The percentage of companies paying dividends is pretty close in each geography as is the percentage of companies raising and cutting dividends in the last year.


10. Energy has been the best performing sector YTD while technology has been the worst. This has been consistent across developed markets.


11. Performance trends across the emerging market sectors have been more diverse, but the overall trend of energy outperformance is similar to that of the developed markets.


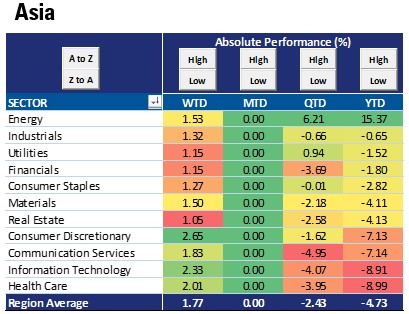
12. At the aggregate level, the energy and utility sectors are the only sectors not oversold (under 30%).

Across geographies some trends become apparent. Asia ex-energy is very oversold, especially the consumer staples and health care sectors.


13. At the aggregate level, the energy sector is the only sector that is not oversold (under 30%).

Across geographies some trends are relatively similar, with the tech and consumer discretionary sectors exhibiting the worst internal trends.


14. At the aggregate level, only 9% of developed market stocks are not in a correction or bear market.

In EMEA and Asia, over a third of the market is in a bear market while less than 10% isn’t in a correction or bear market.


15. In the emerging markets, there are a similar number of stocks in bear market territory as in the developed markets.
Overall, internals in South America are the best in the emerging markets.


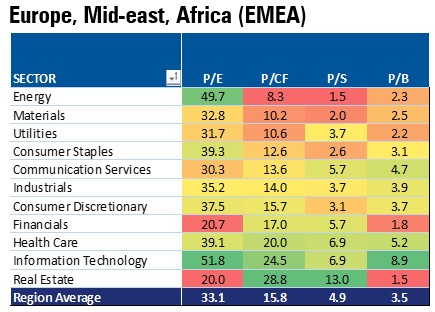
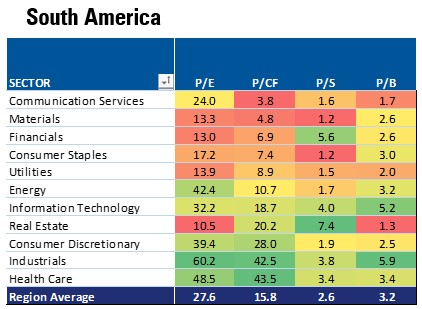
16. Considering valuations, in the aggregate, the consumer staples sector is the cheapest on an intangible-adjusted price/cash flow basis.

In EMEA and Asia, valuations are lower than in North America. The cheapest sector in the developed world is developed Asia consumer staples.


17. In the emerging markets, there are a similar number of stocks in bear market territory as in the developed markets.

The emerging market energy sector is selling at a discount. The discount on EMEA names is warranted since many are Russian. But the South American and Asian names offer attractive value without the same level of geopolitical risk.


18. Drilling down on the Japanese consumer staples sector, we can see many cheap stocks per our intangible-adjusted price/cash flow. From brewers to food producers to drugstores, there are many cheap Japanese consumer staples stocks. All but four stocks sell for less than 10x intangible-adjusted cash flow.
For a value conscious global investor, we think this is a great shopping list.

As of 3/31/22, Coca-Cola Bottlers Japan, Takara Holdings Co., CALBEE, Kewpie Corp, Lion Corp, Sundrug Co, Pola Orbis Holdings, Nissin Foods, MatsukiyoCocokara, Rohto Pharmaceutical, Fancl Corp, Kobayashi Pharmaceutical, and Seven & I Holdings were held in the Knowledge Leaders Strategy and the rest of the companies were not.
Data source for all tables: Knowledge Leaders Capital, Factset, as of 5/31/22.
