

Quarterly Strategy Report: Has Innovation Bottomed?
September 28, 2022It appears to us that global innovation has bottomed and offers attractive value. An extended analysis follows in our Quarterly Strategy Report: Has Innovation Bottomed?
Prefer to download this presentation in PDF? Please click here.
1. Summary
-Innovation as a factor appears have bottomed earlier in 2022. Looking at the quintile spread for the R&D sales factor reveals the factor underperformance has ended for the major developed regions of the world.
-The Bloomberg R&D Leaders Index is a great proxy for the most innovative companies in the US. It has experienced a record valuation drawdown relative to the S&P 500 Index, but that drawdown ended in May. Given the magnitude of actual and projected rate hikes we’ve experienced since then, it is amazing this long duration group of stocks has held the line. Perhaps they have fully discounted the rate hiking cycle and/or economic and profits recession potentially ahead.
-The Bloomberg R&D Leaders Index has seen its EPS grow by 12.58% over the last 15 years, while the S&P 500 grew EPS at a 6.82% compound rate. The Bloomberg R&D Leaders sells for 21.58x forward EPS while the S&P 500 sells for 17.15x forward EPS. This means the Bloomberg R&D Index P/E-to-Growth Rate is 1.72x while it is 2.51x for the S&P 500. This means on a P/E-to-growth valuation basis, the Bloomberg R&D Leaders Index sells for a 31% discount.
-Our Knowledge Leaders baskets have exhibited similar lows this year. Our Asia basket bottomed compared to the S&P 500 in April; our Knowledge Leaders North America made a relative low in May; our Knowledge Leaders Europe basket made a relative low in June.
-It appears to us that global innovation has bottomed and offers attractive value.
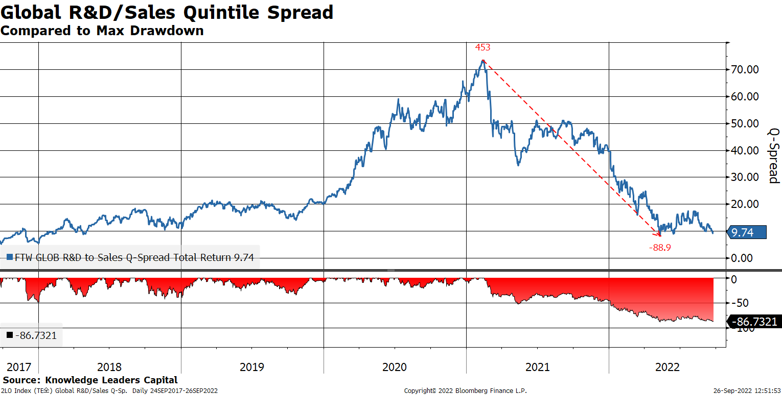
2. The Bloomberg Global Index quintile spread bottomed in May 2022, down over 88.9% from the February 2021 peak.
3. For the US, the S&P 500 quintile spread made a new low recently on September 21, 2022. This is a 22-month 67.6% decline. Interestingly, the q-spread increased by a couple points from the day before the Federal Open Market Committee (FOMC) press conference to Friday (9/23/22) while stocks overall slid. Could this mean these longer duration assets have finally discounted peak Fed hawkishness?

4. For small cap stocks, the quintile spread made a low in May 2022, down over 101% from the high in April 2020.

5. In Europe the story is similar. The Bloomberg Western Europe Index quintile spread made a low in May 2022, down over 75% from the October 2020 high.

6. In Japan, the Nikkei 225 quintile spread made a low in May 2022, down 104% from the August 2020 high.

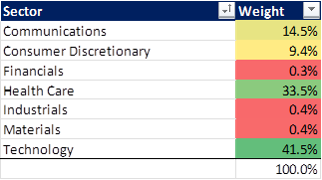
7. The Bloomberg R&D Leaders Index is heavily weighted toward the most innovative sectors. It is a great tool to evaluate highly innovative companies.

8. The Bloomberg R&D Leaders Index has experienced 48% P/E compression in the last 18 months while earnings rose over 40%. This is the largest valuation re-rating ever for this index… even larger than 2008-09.

9. Pause that refreshes? Just like in 2009-2011 the Bloomberg R&D Leaders Index is consolidating gains. If past is prelude, this presages another multi-year advance.

10. The Bloomberg R&D Leaders Index has above-average long-term fundamentals, growing sales, earnings, cash flow and book value at double digits rates for the last 15 years.

11. Which index would you rather own: one with 58% gross margins or 34.5% gross margins?

12. Net profit margins are about 5.5% higher for the Bloomberg R&D Leaders Index compared to the S&P 500.

13. The Bloomberg R&D Leaders Index offers a return on assets 2.5x higher than the S&P 500.

14. This translates into a return on equity over 10% higher for the Bloomberg R&D Leaders Index compared to the S&P 500.

15. The Bloomberg R&D Leaders Index has considerably less financial leverage than the S&P 500 with a Debt/Equity ratio of 58% compared to the S&P’s 114.9%.

16. Earnings have grown in lock-step with the price of the Bloomberg R&D Leaders Index. The BEst P/E is 20.74x, unchanged from September 2007.

17. The S&P 500 has experienced a growth rate about half that of the Bloomberg R&D Leaders, but it still sells for almost 17x earnings.

18. The Bloomberg R&D Leaders Index has grown EPS by 12.08% CAGR for the last 15 years. The S&P 500 has grown EPS at a 6.73% CAGR in the last 15 years.

19. The Bloomberg R&D Leaders Index has grown cash flow at a 12.06% CAGR. The S&P 500 has grown cash flow at a 6.31% CAGR.

20. The Bloomberg R&D Leaders price/cash flow relative to the S&P 500 is spot on the long-term average, having declined from 2 standard deviations above trend in 2020.

21. Capitalization of Intangible Investments
For a group of highly innovative companies like those in the Bloomberg R&D Leaders Index, fundamentals and valuations can be misleading due to SFAS #2 (from 1974) which forces companies to expense all research and development expenses. For highly innovative companies, this can lead to very distorted readings for earnings and operating cash flow. For example, in the Bloomberg R&D Leaders Index, the sum of R&D expense for the 135 companies in the index is $375 billion, while reported aggregate net income is $560 billion. If R&D was treated like capital spending, this expense would not exist, thereby boosting cash net income to $935 billion. The market cap of the Bloomberg R&D Leaders Index is $13.6 trillion. Using, this adjusted cash net income, the adjusted P/E is 14.55x—a discount to the S&P 500.
It is for this reason that—as part of our investment process—we capitalize R&D (and other intangible investments) to remove the distortions caused by SFAS #2. In the following pages we show Price/Cash Flow of some highly innovative industries on a reported basis compared to our intangible-adjusted valuation metrics. Using our method creates the appearance of much greater value than reported statistics.
22. US Large Cap Application & System Software (top 70% of market cap) Valuations Price/Cash Flow

The more intangible spending a company does, the greater the difference between reported and adjusted valuations. In some cases, the difference can be significant, with intangible-adjusted valuations up to 50% cheaper than reported.
(As of 6/30/22, Intuit and Synopsis were held in the Knowledge Leaders Strategy and the rest were not.)
23. US Large Cap Biotech, Health Care Equipment, Life Science Tools & Pharmaceuticals (top 70% of market cap) Price/Cash Flow

(As of 6/30/22, Agilent Technologies, Becton, Dickinson and Company, Bristol-Myers Squibb, Danaher Corp., Eli Lily and Co., Gilead Sciences, Illumina, Johnson & Johnson, Merck, Stryker, and Thermo Fisher Scientific were held in the Knowledge Leaders Strategy and the rest were not.)
24. US Large Cap Communication Services (top 70% of market cap) Price/Cash Flow

(As of 6/30/22, Activision Blizzard and Meta Platforms Inc. Class A were held in the Knowledge Leaders Strategy and the rest were not.)
25. US Mid & Large Cap Internet & Direct Marketing Industry (top 70% of market cap) Price/Cash Flow

(As of 6/30/22, eBay and MercadoLibre were held in the Knowledge Leaders Strategy and the rest were not.)
26. Our Knowledge Leaders Asia group of companies made a low relative to the S&P 500 Equal Weight Index in April. This basket is an equal-weight group of 274 mid-large cap (top 85% of market cap) companies from developed Asia (not including Hong Kong, which we define as an emerging market) designed to identify highly innovative companies.

27. This is our Knowledge Leaders North America basket, which is an equal weight group of mid-large cap companies (top 85% of market cap) that pass our proprietary screens designed to identify highly innovative companies. There are 234 mid-large companies in the basket from the US and Canada. The basket made a double low in May relative to the S&P 500 Equal Weight Index.

28. This is our Knowledge Leaders US Small Cap basket, which is an equal weight group of small cap companies that pass our proprietary screens designed to identify highly innovative companies. There are 462 small cap companies in the basket from the US (85th-99th percentile of market cap). The basket made a double low in May relative to the S&P 500 Equal Weight Index also.

29. Next is our Knowledge Leaders Europe basket of companies. The basket is comprised of 219 mid-large cap companies (top 85% of market cap) from developed Europe that pass our Knowledge Leader screens. It is equal weight and made a low relative to the S&P 500 Equal Weight Index in early June.

30. Let’s finish up by looking at a few other indexes designed to track highly innovative companies. The Goldman Sachs Non-Profitable Tech Index made a low relative to the S&P 500 in May. Many of these “unprofitable” companies would avail themselves to be profitable if R&D were capitalized like in our methodology.

31. The Goldman Sachs Long Value/Short Secular Growth Index peaked in May/June 2022. Since then, secular growth stocks have outperformed value stocks in this index, even after the huge rise in interest rates.

32. The NYSE FANG+ Index made a low relative to the S&P 500 in May and is over 5% higher than the lows.

33. We’ll close with the Bloomberg R&D Leaders Index. It made a low relative to the S&P 500 in May and despite the massively hawkish turn made by the Fed, the relative lows are holding. Has innovation fully discounted the anticipated rise in interest rates and the challenging economic environment?

Prefer to download this presentation in PDF? Please click here.
Disclosures
Charts and data: Factset, Knowledge Leaders Capital, as of 9/23/22
The S&P 500 Index, or the Standard & Poor’s 500 Index, is a market-capitalization-weighted index of the 500 largest publicly-traded companies in the U.S.
Knowledge Leaders Capital identifies Knowledge Leaders, or highly innovative companies, by measuring a company’s investment in its future growth. Knowledge Leaders possess deep reservoirs of intangible capital as a result of their history of investing in knowledge-intensive activities like R&D, brand development and employee education. Developed by founder Steven Vannelli and based on decades of academic research, our proprietary model adjusts a company’s financial history to capitalize these investments and reveal the companies with the greatest knowledge intensity. The companies that pass our quantitative screen are identified as Knowledge Leaders.
The Bloomberg Global Index includes the largest 3,000 companies in the world, developed and emerging.
The Bloomberg Western Europe Index includes the largest 1,500 companies in developed Western Europe.
The Nikkei 225 Index measures the performance of 225 large publicly owned companies in Japan from a wide array of industry sectors.
The Goldman Sachs Non-Profitable Tech Index consists of non-profitable US-listed companies in innovative industries.
The Goldman Sachs Long Value/Short Secular Growth Index represents the pair trade of going long Value and Short Secular Growth.
The NYSE FANG+ Index is an index that provides exposure to a select group of highly-traded growth stocks of next generation technology and tech-enabled companies.
The Knowledge Leaders baskets consist of those highly innovative companies identified as Knowledge Leaders using Knowledge Leaders Capital’s proprietary methodology. Via this process, historic intangible investments are capitalized for every company in the selection universe. (The selection universe consists of the top 85% of the market capitalization of equities of each country, excluding Hong Kong and penny stocks, eliminating the bottom 10% of stocks by trading liquidity). Using the new, intangible-adjusted history, each company is run through a proprietary Knowledge Leader screen. Companies that pass through every level of the screen emerge as Knowledge Leaders.
The Knowledge Leaders Asia basket consists of those Knowledge Leaders in Asia. The Knowledge Leaders North America basket consists of those Knowledge Leaders in North America. The Knowledge Leaders US Small Cap basket consists of those small-cap Knowledge Leaders in the United States. The Knowledge Leaders Europe basket consist of Knowledge Leaders in Europe. Methodology: Knowledge Leaders Capital.
A quintile spread is calculated as the equal-weighted return of the top 20% of stocks as ranked by a metric or style composite minus the equal-weighted return to the bottom 20% of stocks ranked by the same metric.
The information contained herein is provided for informational purposes only and should not be regarded as an offer to sell or a solicitation of an offer to buy the securities or products mentioned, nor should it be regarded as investment, tax or legal advice. Please consult an appropriate professional advisor for advice specific to your situation. Knowledge Leaders Capital may deviate from the opinions, investments, or strategy implementation as discussed in this presentation. The strategies discussed in the presentation may not be suitable for all investors. Knowledge Leaders Capital makes no representations that the contents are appropriate for use in all locations, or that the transactions, securities, products, instruments, or services discussed are available or appropriate for sale or use in all jurisdictions or countries, or by all investors or counterparties.
An investor cannot invest directly in an index.
Past performance or historical trends are not indicative of future results.
