Fed Says No Reach for Yield, But Fund Flow Data Show Otherwise December 04, 2013
By in Uncategorized
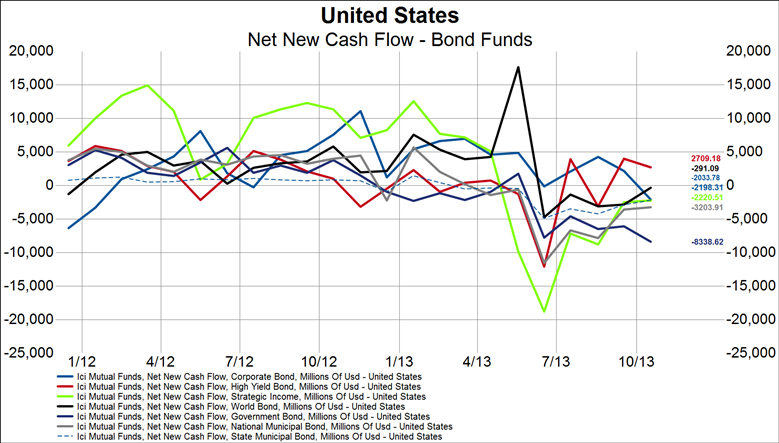
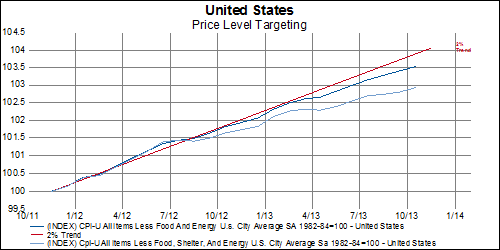
We’ve heard repeatedly from Fed officials that there is no observable reach for yield, but mutual fund flow data paint a different picture.
Read More