Blog

German Ifo Business Climate Survey October 25, 2013

By Knowledge Leaders Team in Uncategorized

Today’s disappointing Ifo Business Climate Survey was lead by a general drop in the assessment of the Services Sector and, in particular, a sharp fall in the expectations component:The overall moderation does not, however, appear to bode poorly for the upcoming release of economic output in the third quarter:

Read More

Microsoft and CA Inc both beat 3Q expectations October 25, 2013

By Knowledge Leaders Team in Uncategorized

In our quarterly call yesterday, ”Investing in a Post QE World” (here is a link to a video of the presentation), we highlighted the systems software industry as one where value is still compelling and many of the companies in that industry are very shareholder friendly. In particular, we highlighted Microsoft and CA Inc.

Read More

Usefulness of Shiller P/E October 24, 2013

By Knowledge Leaders Team in Uncategorized

We received a question today regarding the usefulness of the Shiller P/E.  For starters, it has a wonderful long-term history.  There aren’t many series where we have 130 years of history.

Read More

A Not So Random Walk in 2013 October 24, 2013

By Knowledge Leaders Team in Uncategorized

Everyone that’s read Burton Malkiel’s A Random Walk Down Wall Street learns the idea that the movement of stocks is random–they can rise or fall on any given day.  Like a hitter in baseball or a shooter in basketball, players can go on ”runs” that temporarily give the appearance of non-randomness.

Read More

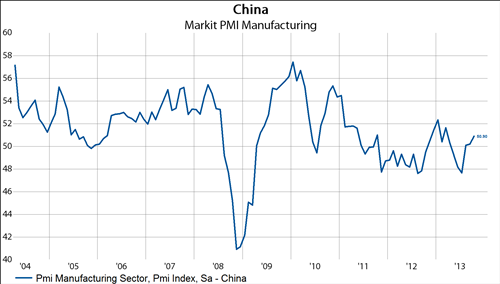
China’s flash manufacturing PMI came in at 50.9 in October vs the official reading of 50.2 in September. Readings above 50 signal expansion. The rise was mostly driven by the backlog of work and employment components (though the employment component remains below 50), but new export orders registered a small gain as well.

Read More

Rally Like It’s 2009 October 24, 2013

By Knowledge Leaders Team in Uncategorized

We perform a variety of calculations to understand the often imperceptible changes in the underlying structure of the stock market.  One calculation we make is to measure the percent of stocks making a new 200-day high.  Historically this metric gets the most extended during the first move off a major low–like in September 2009.

Read More

Employment in the US & Stock Valuations October 23, 2013

By Knowledge Leaders Team in Uncategorized

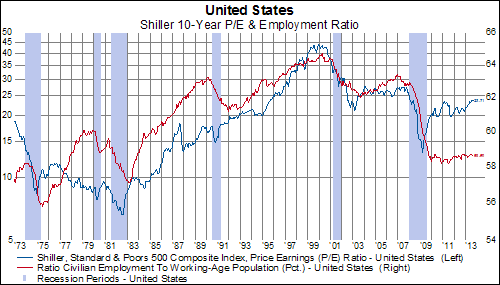
For the last 40 years, the employment to population ratio has been well correlated with equity valuations.As would make sense, when more people are working, income is higher, demand is more sustainable and investors rationally capitalize corporate earnings at a higher rates.  When employment rates are low, the opposite happens.

Read More