

Exploring Dollar Strength and its Effect (or not) on EPS and Sales Growth Expectations
February 03, 2015Last week we wrote a few posts here, here and here noting the significant deterioration in EPS and sales growth estimates over the last few months. Broadly speaking, we’ve seen the next twelve month growth estimates both fall to the lowest level since 2009 (level) and fall sharply (flow, or rate of change) for North America and Europe while developed Asia and EMs have bucked that trend. Here we’ll take a closer look at the US dollar’s involvement in this phenomenon.
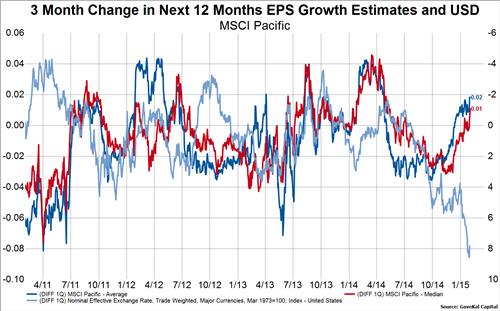
In the first four charts below we have overlaid the three-month change in the nominal effective trade weighted dollar (light blue line, right axis, inverted) on top of the three-month change in the average (dark blue line, left axis) and median (red line, left axis) next twelve months EPS growth estimates for each developed market region and EMs. To be clear, we are not looking at the absolute level of the USD or expected EPS growth, but what that level is now compared to what it was three months ago.
For both North America and Europe, there is an unmistakable relationship between a higher dollar and lower EPS growth estimates. For developed Asia, the relationship is either nonexistent or positive (higher dollar, higher expected EPS growth), which makes sense given Japan’s export prowess. For EMs, the relationship is usually negative (higher dollar equals lower expected EPS growth), but that relationship has clearly been broken this time around.
In the next four charts below we are overlaying the three-month change in the USD on top of the three-month change in next twelve months sales growth estimates. In the same way as above we are not looking at the absolute level of the USD or expected sales growth, but the what that level is now compared to what it was three months ago.
The conclusions we draw on the dollar’s impact on expected sales growth are basically the same as those we drew from the dollar’s impact on expected EPS growth: North America & Europe=negative correlation, developed Asia=mixed correlation, EMs=negative correlation usually, except this time.
The above clearly begs the question of why EMs are bucking this trend in lower estimates given the long-standing relationship with the dollar. The first thing that comes to mind is that the drop in oil prices is having a disproportionately positive impact on EMs. That may well be true this time around, but as the chart below shows, changes in past expected growth rates out of EMs has been positively correlated with changes in oil prices. This makes sense as sensitive to liquidity flows such as oil and EM corporate growth usually move in the same direction. In this chart we plot the three-month percent change in oil (light blue line, right axis) against our EPS growth estimates.
So what about a different hypothesis as to why EM growth expectations are not coming down given the strong dollar? Perhaps low inflation is good for EM economies?
In the chart below we overlay our World CPI Proxy on top of the 6-month difference in EPS growth estimates. The CPI Proxy is the light blue line on the right axis, which is inverted. Here we see that lower CPI readings tend to coincide with higher EPS growth expectations.
